
Join the Quant Scientist Newsletter
Gain access to exclusive tools that Wall Street's Elite don't want you to have. Don't miss the next issue...
Join 11,500+ Quant Scientists learning one article at a time
Join 11,500+ Quant Scientists learning one article at a time
10 Mistakes Algorithmic Traders Make (How To Use Python To Help)
Jason Strimpel and I have been knee deep in building the Python for Algorithmic Trading course. On our last call, we focused on the mistakes that beginner Quants make. This article gives a sneak peek into the intricacies of the Python research code. We cover:
Algorithmic Trading Mistakes that KILL Profitability
BONUS: Python Code: SMA, EMA, & Kalman Filter 👇
Join the Quant Scientist Newsletter (and Get the Code)
Want exclusive access to our FULL codebase for this Quant Science tutorial plus dozens more? The code is in the QS004 Folder. Join here:

Mistakes in Algorithmic Trading that Kill Profitability
There are 10 key mistakes that kill profitability. We'll discuss today, and then focus on how to fix the 1st of the 10 key mistakes. So let’s dissect ten common mistakes that can kill profitability for algorithmic traders.
1. Overfitting Models (Our focus for today)
Overfitting is akin to trying to hit a moving target with a solution tailored to a snapshot in time. If a model is overly complex, tailored to past noise and anomalies, it may fail when exposed to new data. It’s like designing a key 🔑 that fits one specific lock perfectly but fails to open any others. Traders need models that generalize well to unseen data, focusing on signal over noise.
2. Ignoring Transaction Costs
Ignoring transaction costs is like overlooking the leakage in a water container, slowly draining profitability. For example, a strategy may appear profitable in simulation but, when the real-world impact of commissions and slippage is considered, the gains evaporate, leaving the trader in a loss.
3. Lack of Robustness
A strategy lacking robustness is like a fragile glass sculpture, beautiful but shatters at the slightest disturbance. For instance, a model that performs well in a specific market condition may incur substantial losses when the market shifts, be it due to news, events, or economic changes.
4. Underestimating Market Impact
It’s like a heavy rock thrown in a pond; larger trades create ripples—distorting prices and reducing profitability through slippage. Traders need to gauge and mitigate the impact of their trades on market prices accurately.
5. Insufficient Risk Management
Without adequate risk management, traders are like sailors navigating stormy seas without a compass. A string of losses can quickly escalate and consume the trading capital if proper stop-loss and position sizing strategies are not in place.
6. Inadequate Backtesting
Backtesting with biases or over-reliance on in-sample data is like rehearsing a play in a controlled environment and expecting a flawless performance amidst unforeseen disruptions. A strategy might exhibit stellar performance during backtesting due to over-optimization but may fail in live trading due to market shifts, transaction costs, or slippage.
7. Ignoring Technology Risks
Technology risk in algorithmic trading is like the silent structural flaws in a building, unnoticed but catastrophic when they fail. Glitches, latency, or outright technical failures can lead to massive losses, especially in high-frequency trading, emphasizing the need for rigorous system testing and monitoring.
8. Poor Execution
Poor execution algorithms are like dull scissors trying to cut a fine fabric, leading to imperfect outcomes. Suboptimal execution can result in poor fill prices and increased costs, slowly eroding the edges of a seemingly profitable strategy.
9. Data Snooping Bias
Repeated use of the same dataset for tweaking is akin to over-tuning a musical instrument, leading to discord rather than harmony. Iteratively using the same data to design and modify a strategy can lead to overfitting, where the strategy becomes overly tailored to the data and performs poorly in real-world trading.
10. Ignoring Macro-Economic Indicators
Overlooking macroeconomic trends is like ignoring the changing weather patterns while planning a harvest. Ignorance of macro-economic indicators and trends can result in unexpected market moves, significantly impacting algorithmic strategies and their performance.
Python for Algorithmic Trading Example: Avoid Overfitting with Moving Averages & Kalman Filter
In the domain of algorithmic trading, the profitability of a model is judged by its ability to make accurate predictions and adapt quickly to the changing market environment. By utilizing methodologies like Simple Moving Average (SMA), Exponential Moving Average (EMA), and Kalman Filters, traders can smooth out short-term price fluctuations, emphasize longer-term trends, and adjust to the market’s inherent unpredictability.
Comparison
SMA is simple, easy to implement but reacts slowly to recent price changes due to equal weighting of all prices in the window.
EMA reacts faster to recent price changes due to more weight to the latest prices.
Kalman Filter is more sophisticated and can adaptively weigh incoming measurements based on their estimated noise level, potentially providing superior results in many applications. However, it has key parameters that must be tuned to get good results.
See the discussion below for the Python implementation for each of these algorithms.
Step 1: Python Imports & Price Data
First, let's import some necessary libraries for data analysis in Python. Namely pandas and matplotlib. Then we create sample stock price data and format the data for analysis.

This generates the following price data. We will apply noise reduction techniques.

Step 2: Moving Averages: SMA and EMA
Next, let's add two noise reduction algorithms. A simple moving average (SMA) and an exponential moving average (EMA). These techniques are relatively easy to use. However they have one drawback: they are lagging indicators meaning they can only help detect trends that are already present in the data. Run the following code to create 2 new columns, one for the 3-Day SMA and one for the 3-Day EMA. The SMA only has 1 parameter: window_size. The EMA has 2 additional parameters that control the exponential weighting: halflife and alpha.

The data now has two additional columns, one for the sma and one for the ema.

Step 3: Kalman Filter
The last step is to apply the Kalman Filter. A Kalman filter has 3 main parameters that affect the filtering: estimation_error, process_variance, and measurement_variance. We can implement in Python by running this code:

Here's the Kalman Filter added to the pandas data frame:

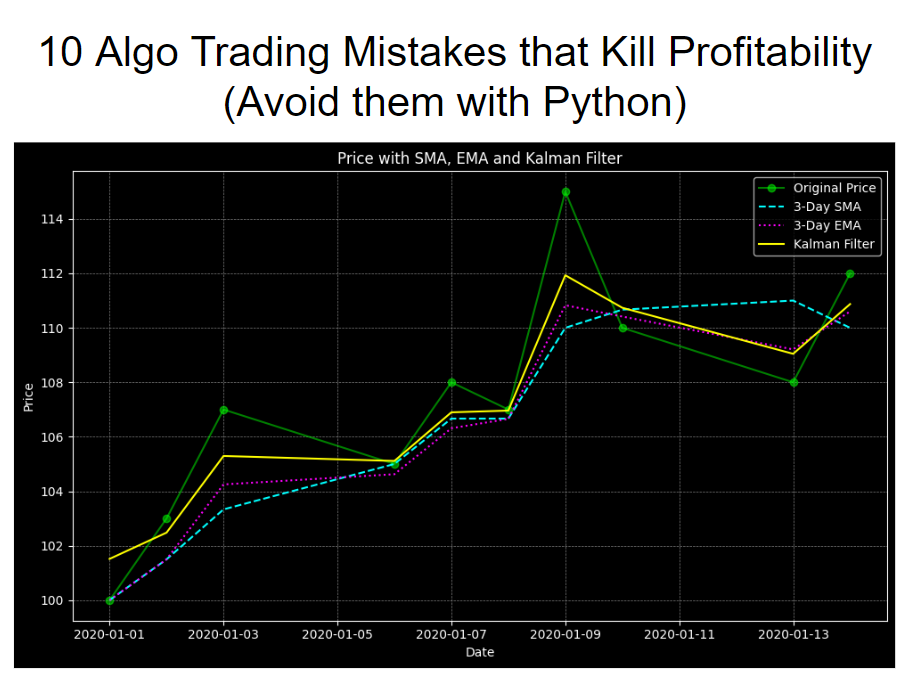
Step 4: Visualize the Noise Reduction
The last step is the most important. Now that we have several filters applied to smooth our data, we want to inspect the results. We'll do so with matplotlib. Run the following code.

And here's the final visualization. We can see each of the 3 noise-reduction techniques applied to our data. And now we have signal through the noise!

Conclusion: Python is great for stock analysis
By meticulously employing these strategies within the provided code, algorithmic traders can significantly enhance the reliability and performance of their trading models, steering clear of common pitfalls like noise-induced inaccuracies and overfitting-induced generalization errors, thus paving the way for more informed and profitable trading decisions.
Ready to take your investment game to the next level? Embracing Python for algorithmic trading can be a game-changer for your portfolio. If you're new to Python or want to sharpen your skills for financial analysis, our upcoming Python for Algorithmic Trading Course is the perfect opportunity. See you in our Python Algo-Trading course!
Are you feeling lost when trying to learn Algorithmic Trading?
There's nothing worse than going at this alone--
❌ Learning Python is tough.
❌ Learning Trading is tough.
❌ Learning Math & Stats is tough.
It's no wonder why it's easy to feel lost.
And all of this increases the likelihood you will fail (not to mention lose money in the process). Protect your future.

👉 Join 2200+ future Quant Scientists on our Python for Algorithmic Trading Course Waitlist: https://learn.quantscience.io/python-algorithmic-trading-course-waitlist


Start Your Journey To Becoming A Quant Today!
Join the Quant Scientist Newsletter
Gain access to exclusive tools that Wall Street's Elite don't want you to have. Don't miss the next issue...
Join 11,500+ Quant Scientists learning one article at a time
Join 11,500+ Quant Scientists learning one article at a time