
Join the Quant Scientist Newsletter
Gain access to exclusive tools that Wall Street's Elite don't want you to have. Don't miss the next issue...
Join 11,500+ Quant Scientists learning one article at a time
Join 11,500+ Quant Scientists learning one article at a time
How to use Anomaly Detection for Algorithmic Trading in Python
We're getting close to the launch of the Python for Algorithmic Trading course, and Jason and I recognize the need to fill you in on some powerful algorithmic trading strategies we are exploring. In the last edition, we announced pytimetk, a new Python package that we developed based on our OWN PERSONAL TIME SERIES PACKAGES. This article serves as an introduction to Anomaly Detection with pytimetk, a new strategy based on one of our student's whom it helped break the chain of losses and start getting wins. We cover:
Why Anomaly Detection for Algorithmic Trading?
Full Code Tutorial: Anomaly Detection with Pytimetk
BONUS: Get the Python Code for EVERYTHING you see in this post
Quick favor - We're preparing for the launch of our new course, and if you can spare 60 seconds, we'd love to hear what you want out of the course. Click here to enter your 60-second survey.
Join the Quant Scientist Newsletter (and Get the Code)
Want exclusive access to our FULL codebase for this Quant Science tutorial plus dozens more? The code is in the QS006 Folder. Join here:

Why Anomaly Detection for Algorithmic Trading?
Anomaly detection in the context of algorithmic trading can be crucial for detecting patterns that indicate entry and exit positions. Before we dive in, it's important to understand that Buyers and Sellers dictate the price of any stock, mutual fund, or financial instruments. Because of this relationship between the Buyers and Sellers, there is a natural "tug of war" that goes on.
When a stock price increases, at a certain point Sellers overtake the Buyers. And the stock price tends to go down. When a stock price decreases, the opposite pattern emerges. At a certain point the Buyers overtake the Sellers, and the stock price then begins to increase.
The key is understanding when to enter and exit during this tug of war. How can we tell?
Anomaly Detection for Indicating Potential Entry/Exit Points
When a stock price increases or decreases beyond its normal range, these are anomalies. And we can use these patterns to identify potential Entry/Exit points.

How Anomaly Detection can identify potential Entry/Exit Points
[Code Tutorial] Anomaly Detection with Pytimetk.
Pytimetk is brand new, (it's our personal toolkit for time series and financial analysis)...

And we have just recently added a new set of functions for Anomaly Detection. Note: We need to use pytimetk>=0.1.0.9001 to use the new anomaly detection functions.
We'll use the new anomalies() function and it's supporting plotting functions to show you how fast we can analyze multiple stocks for potential entry/exit points.

Analyzing Multiple Stocks for Entry/Exit Points with Pytimetk Anomalize
Step 1: Installation
The first thing to do is to install pytimetk into your Quant Stack. Our official quant stack contains python packages like openbb, alphalens, pyfolio. And pytimetk fits right in.
Installation
Because we are under active development, it's best to install the Development Version of Pytimetk. You can do so here.
pip install git+https://github.com/business-science/pytimetk.gitStep 2: Import the Packages and Get the Dataset
Next, here's how we recommend to import pytimetk as tk. This gets you access to all of the rich functionality that we are about to cover.

Get the code now: It's in the QS006 folder.
Glimpse the Data Set
Next use glimpse. This function allows us to quickly see what columns we have in our dataset, the data class for each column, and what the data looks like for the first several observations.

Get the code now: It's in the QS006 folder.
Visualize the data
We can visualize the data with plot_timeseries().

Get the code now: It's in the QS006 folder.

Step 2: Anomaly Detection with anomalize()
Next, we're ready to "animalize" the adjusted stock prices. The main function we're using is anomalies().

Get the code now: It's in the QS006 folder.
This anomalize() function does 3 things:
Performs STL decomposition: Using a LOWESS smoother, breaks down the time series into seasons, trend components. And removes these components from the time series, leaving a "remainder".
Applies Anomaly Detection to the Remainder: This indicates which values are anomalous, what their anomaly score is, and the cutoff bands (recomposed_l1 and recomposed_l2), which are limits around the time series. Any points beyond these limits are considered anomalous.
Cleans the Time Series: Although not needed for this tutorial, in some cases users will want to remove anomalies. This function does so automatically, and stores the "cleaned" data as observed_clean.
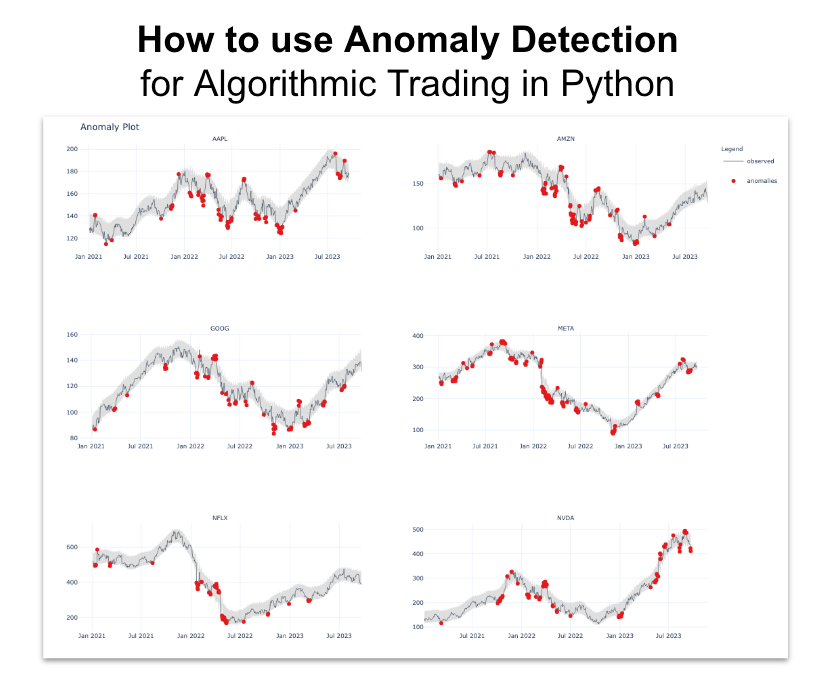
Step 3: Visualize the Anomalies
The last step is to plot the anomalies. For that we have plot_anomalies().

Get the code now: It's in the QS006 folder.
Here's the plot with the anomalies identified.
Get the code now: It's in the QS006 folder.
We can zoom in on any of these stocks to examine potential entry/exit points.
Get the code now: It's in the QS006 folder.
Conclusion: Python is getting even better for Stock Analysis
By now you can tell that we are giving you every POSSIBLE tool and skill to enhance your Algorithmic Trading game.
Ready to take your investment game to the next level? Embracing Python for algorithmic trading can be a game-changer for your portfolio. If you're new to Python or want to sharpen your skills for financial analysis, our upcoming Python for Algorithmic Trading Course is the perfect opportunity. See you in our Python Algo-Trading course!
Are you feeling lost when trying to learn Algorithmic Trading?
There's nothing worse than going at this alone--
❌ Learning Python is tough.
❌ Learning Trading is tough.
❌ Learning Math & Stats is tough.
It's no wonder why it's easy to feel lost.
And all of this increases the likelihood you will fail (not to mention lose money in the process). Protect your future.

👉 Join 3600+ future Quant Scientists on our Python for Algorithmic Trading Course Waitlist: https://learn.quantscience.io/python-algorithmic-trading-course-waitlist


Start Your Journey To Becoming A Quant Today!
Join the Quant Scientist Newsletter
Gain access to exclusive tools that Wall Street's Elite don't want you to have. Don't miss the next issue...
Join 11,500+ Quant Scientists learning one article at a time
Join 11,500+ Quant Scientists learning one article at a time