
Join the Quant Scientist Newsletter
Gain access to exclusive tools that Wall Street's Elite don't want you to have. Don't miss the next issue...
Join 11,500+ Quant Scientists learning one article at a time
Join 11,500+ Quant Scientists learning one article at a time
How to Use Average True Range (ATR) in Python
As we continue to build onto the Python for Algorithmic Trading course, and Jason and I are keenly interested in any algorithms that can give us an edge. And, we want to fill you in on some powerful algorithmic trading strategies we are exploring. Today we're going to share how to use Average True Range (ATR) to find volatility signals. You learn:
Top 10 Filtering Techniques Used in Algorithmic Trading
How is Average True Range (ATR) used in financial analysis, stocks and investing?
Full Python Tutorial: How to use Average True Range (ATR) in Python
BONUS: Get the Python Code for EVERYTHING you see in this post
Disclaimer:
The information and educational material provided by Quant Science, LLC are for educational purposes only and should not be considered as financial advice or recommendations to purchase, hold, or sell any securities or other financial instruments. Before you proceed, please review our full disclaimer here.
Quick favor - We're preparing for the next cohort of our new python for algorithmic trading course. If you can spare 60 seconds, we'd love to hear what would help make you a better trader from our course. Click here to enter your 60-second survey.
Here's the ATR overview:
You will analyze ATR to detect trading patterns for SPY today:

Join the Quant Scientist Newsletter (and Get the Code)
Want exclusive access to our FULL codebase for this Quant Science tutorial plus dozens more? The code is in the QS009 Folder. Join here:

How is Average True Range (ATR) used in Financial Analysis, Stocks, and Investing?
To understand Average True Range (ATR), we need to first get a handle on where ATR falls in the ecosystem of filters that are used to extract signal from noise. For that, we have the following table of 10 Filters Used in Algorithmic Trading:
10 Filters Used in Algorithmic Trading Table:
We can see that Average True Range (ATR) falls under the class of "Volatility Filters".

10 Filters Used in Algorithmic Trading
What are Volatility Filters?
A volatility filter is a tool used in financial trading and investment strategies to manage risk and improve decision-making. It works by assessing the level of volatility, or the degree of variation in the price of a security, asset, or market index over a given period.
Volatility filters typically measure volatility using statistical methods like standard deviation or variance of price movements. This helps in understanding how wildly or predictably a security's price is moving.
By understanding volatility, traders and investors can adjust their strategies accordingly. Higher volatility usually indicates higher risk, so a trader might opt for more conservative positions or use strategies like hedging to manage this risk.
Volatility filters can inform buy or sell decisions. For instance, a trader might set a rule to avoid trading if volatility exceeds a certain threshold, as it could indicate an unstable market.
Some trading strategies adapt according to the level of volatility. For example, in a high-volatility environment, a trader might focus on short-term trades to capitalize on rapid price movements.
Volatility filters can help in setting more effective stop-loss orders. In a high-volatility market, a wider stop-loss might be set to avoid being stopped out by normal price fluctuations.
Now that we understand this class of filters better, let's dive into the Average True Range (ATR) technical indicator.
What is Average True Range (ATR)?
The Average True Range (ATR) is a technical analysis indicator used to measure market volatility. It was introduced by J. Welles Wilder Jr. in his 1978 book "New Concepts in Technical Trading Systems."

Usage in Trading:
There are 2 key points:
ATR does not provide an indication of price direction, instead it measures volatility.
High ATR values indicate high volatility and low ATR values indicate low volatility.
How to Develop Signals:
Traders might use this information to:
Adjust stop-loss orders
Size Positions
Entry/Exit Signals
Note- ATR is often used in combination with other Technical Signals (e.g. trend, price, and volume filters).
How it Works:

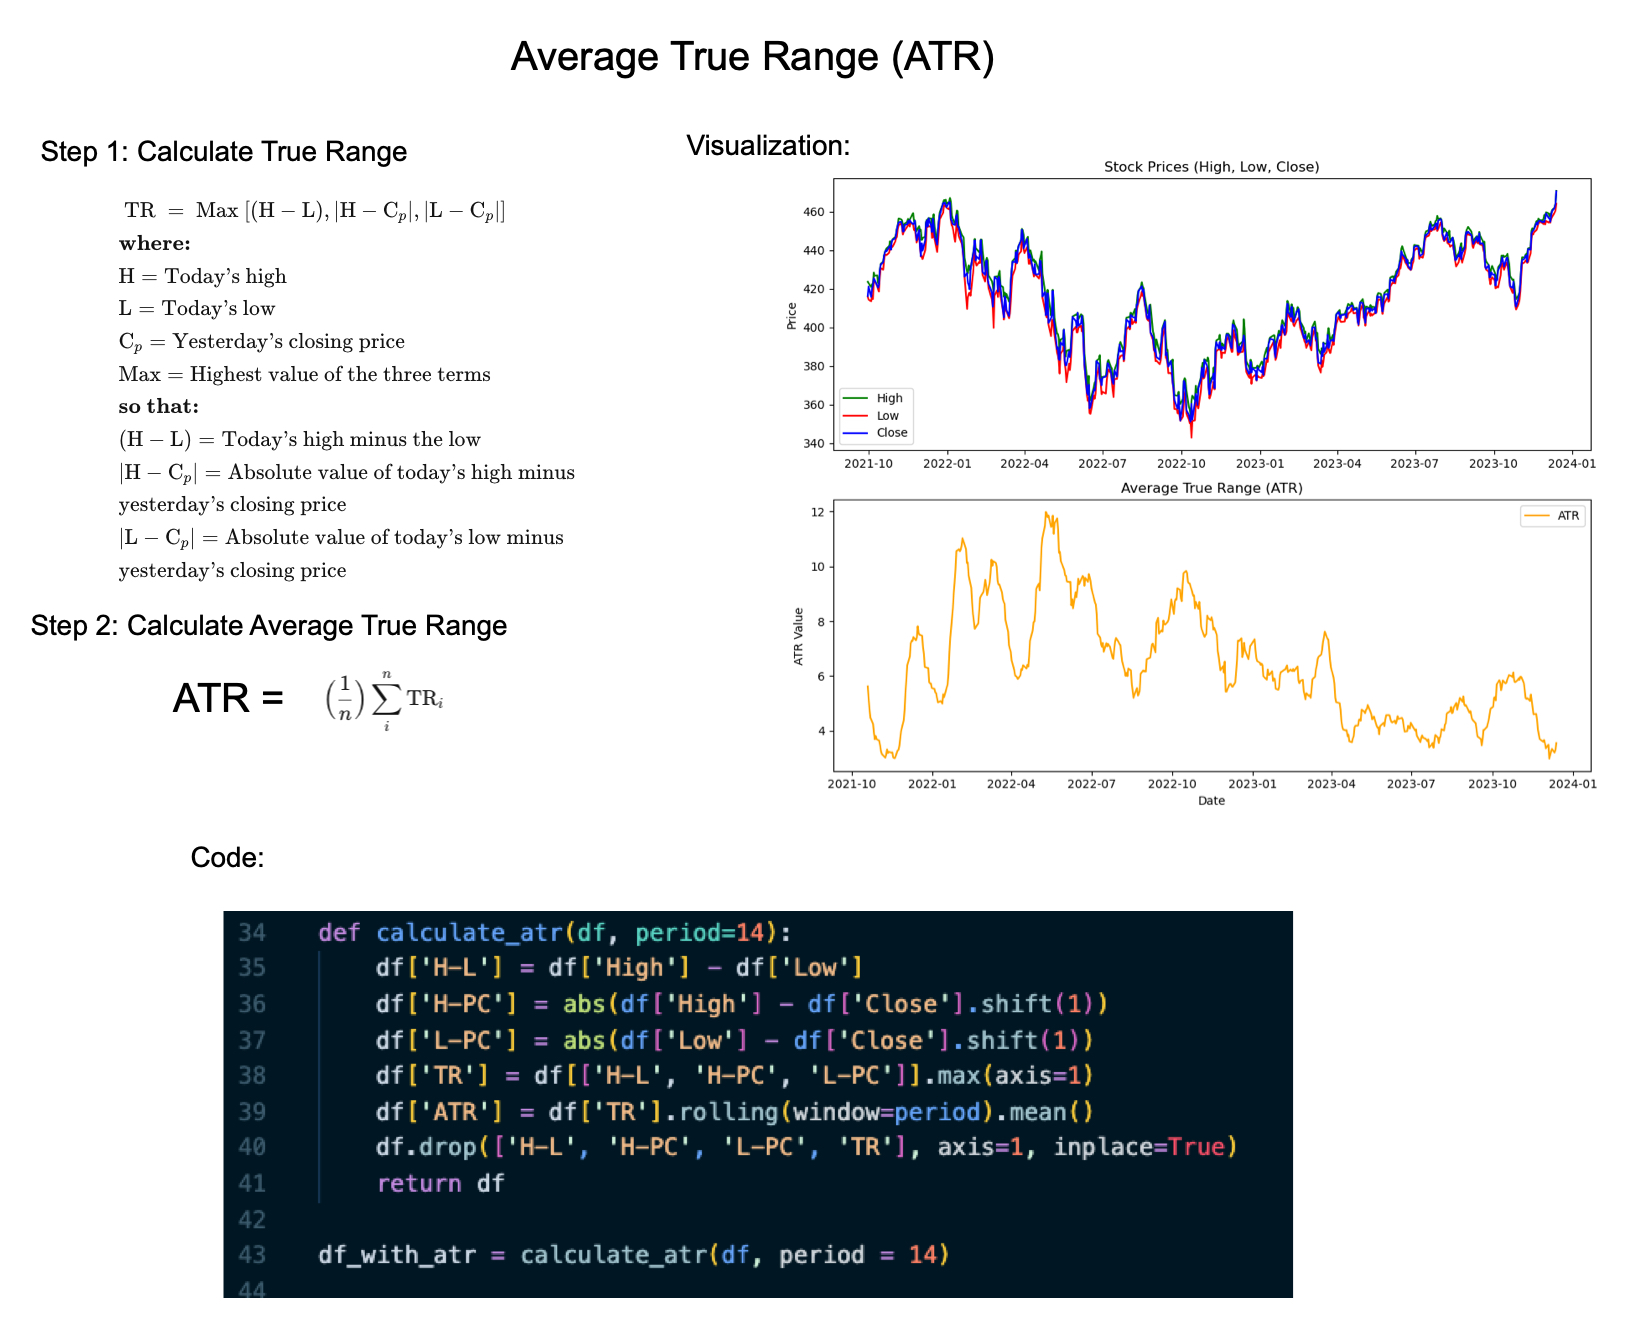
There are 2 steps in calculating the ATR:
Calculate the True Range: The True Range for a given period is the greatest of the following:
The difference between the current high and the current low.
The difference between the previous close and the current high.
The difference between the previous close and the current low.
Calculate the Average True Range: The ATR is an average of the True Range over a specified number of periods.
Python Tutorial: Average True Range
The goal with our analysis is create a volatility signal in the SPY. We use Average True Range (ATR) to detect periods of high and low volatility. Get the code: It's in the QS009 folder.
Step 1: Load Libraries and Get the SPY Data
The first step in our analysis is to load the following libraries and setup our analysis parameters. Run this code:

Get the code: It's in the QS009 folder.
The code produces this visualization. We can see with have the SPY from 2021-09-30 to 2023-12-13.

Step 2: Apply ATR
Next, let's apply the Average True Range. We'll make a custom function calculate_atr() that will add the ATR column to our data frame.
Run this code:

Get the code: It's in the QS009 folder.
This returns the SPY data frame with the ATR Column added:

Step 3: The ATR Visualization
We can visualize the original High, Low, Close and the ATR in a single matplotlib plot. Run this code:

Get the code: It's in the QS009 folder.
The following plot is returned.

Step 4: ATR Analysis
I've marked up the original plot so we can see different regimes in the long term trading patterns for SPY.
High Volatility: We can see that there was a period of high volatility from 2022-01 to 2022-10. During this time period the SPY dropped from $460 to $340, a -26% drop.
Low Volatility: We can see that there was a period of low volatility from 2023-04 to 2023-12. During this time period the SPY increased from $380 to $460, a +21% increase.
Get the code: It's in the QS009 folder.
Conclusion: Python is getting even better for Stock Analysis
By now you can tell that we are giving you every POSSIBLE tool and skill to enhance your Algorithmic Trading game.
Ready to take your investment game to the next level? Embracing Python for algorithmic trading can be a game-changer for your portfolio. If you're new to Python or want to sharpen your skills for financial analysis, our upcoming Python for Algorithmic Trading Course is the perfect opportunity. See you in our Python Algo-Trading course!
Are you feeling lost when trying to learn Algorithmic Trading?
There's nothing worse than going at this alone--
❌ Learning Python is tough.
❌ Learning Trading is tough.
❌ Learning Math & Stats is tough.
It's no wonder why it's easy to feel lost.
And all of this increases the likelihood you will fail (not to mention lose money in the process). Protect your future.

👉 Join 3600+ future Quant Scientists on our Python for Algorithmic Trading Course Waitlist: https://learn.quantscience.io/python-algorithmic-trading-course-waitlist


Start Your Journey To Becoming A Quant Today!
Join the Quant Scientist Newsletter
Gain access to exclusive tools that Wall Street's Elite don't want you to have. Don't miss the next issue...
Join 11,500+ Quant Scientists learning one article at a time
Join 11,500+ Quant Scientists learning one article at a time