
Join the Quant Scientist Newsletter
Gain access to exclusive tools that Wall Street's Elite don't want you to have. Don't miss the next issue...
Join 11,500+ Quant Scientists learning one article at a time
Join 11,500+ Quant Scientists learning one article at a time
How to Use Correlation to Construct Investment Portfolios in Python
Python is crazy for finance and algorithmic trading! In this QS Newsletter (get the code), we are showing how to use correlation to construct investment portfolios in Python. Today, you learn:
Why using uncorrelated assets is important in portfolio construction?
Python Tutorial: How to use correlation to construct investment portfolios in Python
BONUS: Get the Python Code for EVERYTHING you see in this post
Disclaimer:
The information and educational material provided by Quant Science, LLC are for educational purposes only and should not be considered as financial advice or recommendations to purchase, hold, or sell any securities or other financial instruments. Before you proceed, please review our full disclaimer here.
Join the Quant Scientist Newsletter (and Get the Code)
Want exclusive access to our FULL codebase for this Quant Science tutorial plus dozens more? The code is in the QS019 Folder. Join here:

NEW: Free 5-Day Algorithmic Trading Course

Are you interested in learning Algorithmic Trading with Python? Do you want to learn how to execute trades automatically, how to find edge, backtest trading strategies, analyze risk, then take your winning trades from Paper Account to Production (Live Trading)?
If the answer is Yes, then we have a NEW Free 5-Day Algorithmic Trading.
👉 Click here to join our free 5-Day Algorithmic Trading Course.
Why using uncorrelated assets is important in portfolio construction
Using uncorrelated assets in portfolio construction is crucial because it helps to reduce overall portfolio risk while maintaining or potentially increasing returns. Here's why:
Diversification: Uncorrelated assets don't move in tandem. When one asset's value decreases, the other may increase or remain stable, which smooths out the portfolio's overall returns. This diversification reduces the impact of any single asset's poor performance on the entire portfolio.
Risk Reduction: The main goal of diversification is to lower the portfolio's volatility. When assets are uncorrelated, the price movements of one don't affect the others, leading to a more stable portfolio. This risk reduction is essential, especially during market downturns, as it can protect against significant losses.
Optimized Returns: While reducing risk, a well-diversified portfolio with uncorrelated assets can also maintain or improve returns. By spreading investments across assets that don't move together, you can capture gains in different market conditions without exposing the portfolio to undue risk.
Improved Sharpe Ratio: The Sharpe ratio measures the risk-adjusted return of a portfolio. By including uncorrelated assets, the portfolio's risk (volatility) decreases, which can lead to a higher Sharpe ratio, indicating a better risk-adjusted return.
Behavior in Different Economic Conditions: Uncorrelated assets often react differently to economic events. For example, bonds may perform well when stocks decline, or commodities might rise during inflationary periods. Having uncorrelated assets allows the portfolio to perform more consistently across various economic cycles.
Overall, the inclusion of uncorrelated assets in a portfolio is a key principle of modern portfolio theory, as it allows for a better balance between risk and return.
Python Tutorial: How to use correlation to construct investment portfolios in Python
Ok, let's dive in and see how to use correlation to construct investment portfolios in Python. First, make sure to sign up for our Newsletter to get all of the code you see today.
Step 1: Load the Libraries, Data, and Get Returns
In the first step, we'll import the necessary Python libraries, collect stock data for each asset using yfinance, and then convert them to returns. Run this code:

Sign up for our Newsletter to get all of the code you see today
Here are the median daily returns for each asset:

Step 2: Get Correlations
We want to understand whether or not the assets are uncorrelated so we can use these in constructing our portfolio. To do so, we'll calculate the correlation and visualize the results using several techniques. Run this code:

This will create a correlation matrix as a data frame:

Now we are ready to begin visualizing the correlations.
Correlation Plot #1: Seaborn Heatmap
A heatmap is a quick way to see which assets have high and low correlations. Run this code:

One problem is that these assets are not grouped. We can fix that with the next plot.
Correlation Plot #2: Seaborn Clustermap
A clustermap groups the correlations based on distance. The default is Euclidean. Run this code:

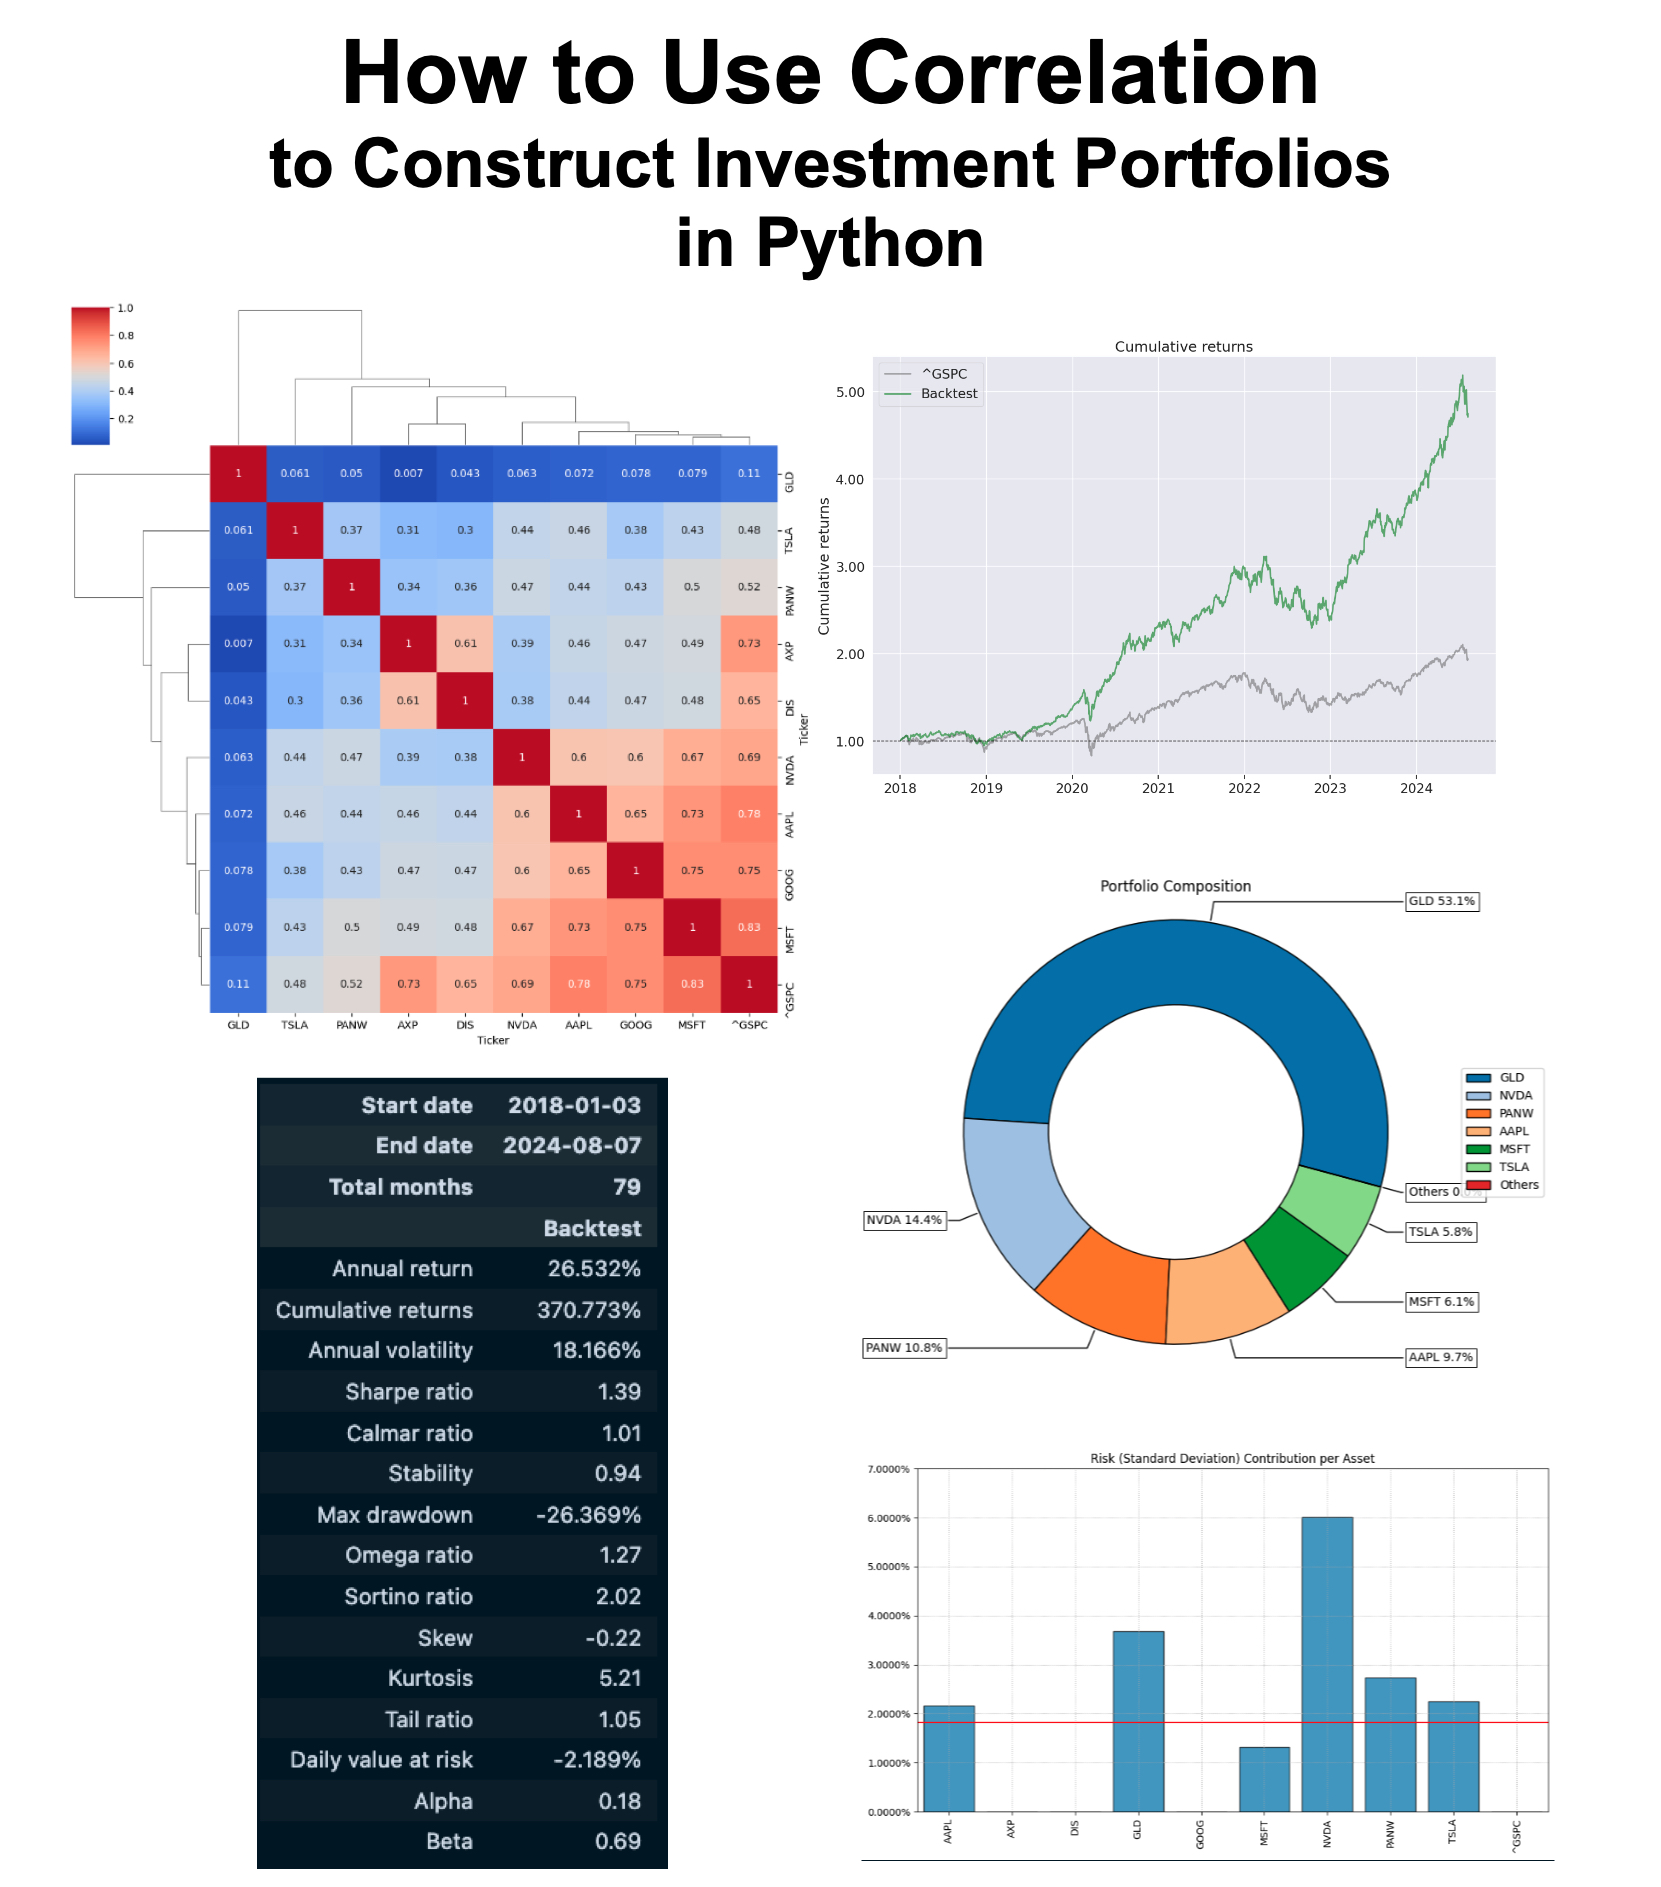
This is better. We can now see that GLD has a low correlation with the Technology Sector Stocks like NVDA, MSFT, and GOOG.
Now we need to figure out how to group them. We'll do that next.
Correlation Plot #3: Riskfolio Cluster Plot
Next, we'll use the riskfolio cluster plot to help us see what groups exist and how we can strategize an uncorrelated portfolio. Run this code:

Great work. We can now see 4 distinct groups. And we can begin to strategize which assets to include in a portfolio.
But we still need to figure out how best to construct the portfolio to weight the uncorrelated assets for highest Sharpe Ratio. We'll take care of that next.
Step 3: Construct the Portfolio
We'll use a technique called Nested Cluster Optimization (NCO). NCO maximizes an objective while incorporating the clustering to reduce the correlation between asset returns. Run This code:
")
Now we have the portfolio weights. Next we can begin to analyze the portfolio.
Step 4: Portfolio Analysis
Pie Chart:
The Pie Chart is a visual representation of the portfolio weights. We can see that the optimization has put over half the portfolio in GLD (SPDR Gold ETF). This is to reduce the correlation with the Technology Stocks.

Plot Drawdown:
Drawdowns help understand the pain an investor would feel during periods of market and portfolio declines. The max drawdown is around -25%, which is comparable with the S&P 500 index during the same time period.

Bonus: Performance Analysis with Pyfolio
We can get portfolio statistics and performance versus a benchmark with Pyfolio. Run this code:

We can see that the NCO Optimized Portfolio versus S&P 500 Benchmark has the following performance:
Total Return: 371% Portfolio Return vs 93% (S&P 500 Benchmark)
Annual Return: 26.5% vs 10.5% Benchmark
Max Drawdown: -26% vs -33.9% Benchmark
Sharpe Ratio: 1.39 vs 0.60 Benchmark
Conclusion: Polars is insane for Finance
Congrats! You just made a risk-managed portfolio that takes advantage of uncorrelated assets to gain a significant competitive edge in investing. There's more to learn in algorithmic trading:
Backtesting your portfolio construction algorithm to make sure the strategy will work in the future
Executing the trades automatically
Monthly rebalancing
Tracking your actual Profit and Loss
Incorporating Trading Fees
Are you interested in learning algorithmic trading strategies that maximize returns responsibly, help you manage risk, and grow your investments? We implement 3 core trading strategies including portfolio, momentum, and spread trades that have worked in our favor in the past and continue to produce results for our students.
Join 300+ of us that are learning to apply python to algorithmic trading to grow investments.
Leo was up 11.5% in just 13 trading days.

Alex was waiting 9 years for a course like this:

Ready to make Algorithmic Trading Strategies that actually work?
There's nothing worse than going at this alone--
❌ Learning Python is tough.
❌ Learning Trading is tough.
❌ Learning Math & Stats is tough.
It's no wonder why it's easy to feel lost, make bad decisions, and lose money.
Want help?

👉 Join 10,700+ future Quant Scientists on our Python for Algorithmic Trading Course Waitlist: https://learn.quantscience.io/python-algorithmic-trading-course-waitlist


Start Your Journey To Becoming A Quant Today!
Join the Quant Scientist Newsletter
Gain access to exclusive tools that Wall Street's Elite don't want you to have. Don't miss the next issue...
Join 11,500+ Quant Scientists learning one article at a time
Join 11,500+ Quant Scientists learning one article at a time