
Join the Quant Scientist Newsletter
Gain access to exclusive tools that Wall Street's Elite don't want you to have. Don't miss the next issue...
Join 11,500+ Quant Scientists learning one article at a time
Join 11,500+ Quant Scientists learning one article at a time
Introducing Pytimetk for Finance and Time Series in Python
As part of building the Python for Algorithmic Trading course, Jason and I recognize the need to push the time series analysis software in Python forward. We are opening up some new functionality that is designed to scale both time series and financial analysis based on our OWN PERSONAL TIME SERIES PACKAGES. This article is a brief introduction to pytimetk, a brand new package we are building to do Time Series and Financial Analysis in Python. We cover:
Why Pytimetk for Financial Analysis in Python?
Fast Experimentation (Part 1): Adding 3 Moving Averages and 3 Moving Medians to 6 Stocks
BONUS 1: Fast Experimentation (Part 2): Adding Customized Bollinger Bands to 6 Stocks
BONUS 2: Get the Python Code for EVERYTHING you see in this post
Special Announcement: Free LIVE Python for Finance Workshop on October 17th
Special Guest: Snowflake ❄️ the Financial Data Science Platform

Click here to join the workshop.
Inside the workshop, Jason Strimpel, Jonathan Regenstein (Snowflake) and I will share how Snowflake is scaling financial and quantitative time series analysis with PyTimeTK. We will demonstrate the code used to analyze 100s of financial investments. And we will give a roadmap for our financial software development and course training programs at Quant Science and our sister company Business Science.
What? Python Time Series for Finance with PyTimeTK (Special Guest: Snowflake ❄️)
When? Tuesday October 17th at 2PM EST
How It Will Help You? Whether you are new to Python for Finance or Time Series Analysis or you are an expert, Pytimetk is changing the game. How can Pytimetk help you become a better Quant Scientist, improve your trading skills, and help you stand out in your career? We'll show you inside our free Python Time Series for Finance Workshop.
Event Sponsors: Snowflake ❄️, Business Science, and Quant Science
Special Guest: Jonathan Regenstein, author of Reproducible Finance and Director of Finance Data Science at Snowflake
Price? How does FREE sound?
👉 How to Join? Register here.
Join the Quant Scientist Newsletter (and Get the Code)
Want exclusive access to our FULL codebase for this Quant Science tutorial plus dozens more? The code is in the QS005 Folder. Join here:

Why Pytimetk for Financial Analysis in Python?
It's no question that Python is a powerful language for algorithmic trading, quantitative analysis, and finance. But when it comes to doing time series analysis, Python and more specifically Pandas takes a lot of code to do simple things at scale.
Both Jason Strimpel and I (Matt Dancho) have been working in Time Series and Financial Analysis for a combined 40 years, and over that time we've created, well, a lot of software (that's an understatement).
With the rise in Python for data science and machine learning, it's now time to take some of our foundational algorithms and time series toolkits and open source them to make things just a little bit easier (and to give you access to the same tools the PROS use).
Enter Pytimetk.
Pytimetk is brand new, and it's our first joint software development initiative at Quant Science and Business Science (our sister company).

The goal of pytimetk is to make Time Series Analysis in Python easier, faster, and more enjoyable. And believe me when I say this... We have A LOT COMING for both Time Series and Financial Analysis. And we want to SHARE it with you!
In fact, Jason and I (Matt) have an upcoming LIVE Workshop with Snowflake (THE BIGGEST company in Financial Data Science). Jonathan Regenstein, Director of Financial Services Data Science at Snowflake is our Special Guest. And we will uncover how Snowflake is using pytimetk to scale financial workloads inside their infrastructure. PLUS we'll share the full roadmap for software development and our Quant Science courses at the event. Register here for Python Time Series for Finance with Pytimetk (Special Guest: Snowflake).
We have 2 brief examples to share today that focuses on fast experimentation. And please attend the workshop to see a more in-depth finance tutorial.
Fast Experimentation (Part 1): Adding 3 Moving Averages and 3 Moving Medians to 6 Stocks
The first thing to do is to install pytimetk into your Quant Stack. Our official quant stack contains python packages like openbb, alphalens, pyfolio. And pytimetk fits right in.
Installation
Because we are under active development, it's best to install the Development Version of Pytimetk. You can do so here.
pip install git+https://github.com/business-science/pytimetk.gitYou can alternatively install the latest stable version with:
pip install pytimetkImport the packages and get the dataset
Next, here's how we recommend to import pytimetk as tk. This gets you access to all of the rich functionality that we are about to cover.

The first thing to do is to install pytimetk into your Quant Stack. Our official quant stack contains python packages like openbb, alphalens, pyfolio. And pytimetk fits right in.
Glimpse the Data Set
Our first function I'd like to introduce you to is glimpse. This function allows us to quickly see what columns we have in our dataset, the data class for each column, and what the data looks like for the first several observations. If you come from the R programming language, you'll notice an immediate parallel to the tidyverse.

Fast Experimentation: Adding 3 Moving Averages and 3 Moving Medians to 6 Stocks
As Jason says, "The best traders have market intuition".
One of the best ways to get market intuition is to do Fast Experimentation. Develop and idea (or strategy), test it, and iterate. This is where pytimetk excels. Let's take a quick example.
Augment Rolling Features
Here let's use a new function called augment_rolling to add MANY rolling time series features. This is great for simple moving averages, moving standard deviations, and more.

Next, glimpse the data to see what's happened:

We now have 6 new features to explore. Not bad for 3 lines of code. Most importantly these 6 features have been added by group. Pytimetk respects Pandas' groupby method.
Critical Step: Visualization
In our fast experimentation, a key component is visualization. For that we have plot_timeseries.
Visualization with plot_timeseries
Run the following code to convert the moving averages to long format and visualize with plot_timeseries. Plot time series uses long-format, this is also a convention from R's tidyverse that makes complex faceted plots possible. To do so we add a melt function to get the columns we want to compare into long format. Then groupby and plot_timeseries.

This produces the following interactive plotly visualization.
Key Point: You can easily scale this to as many time series as needed to explore vast ecosystems of stocks (and even entire indexes).

Moving Medians
We can then make one simple modification to visualize the moving medians.

Then just update the visualization:

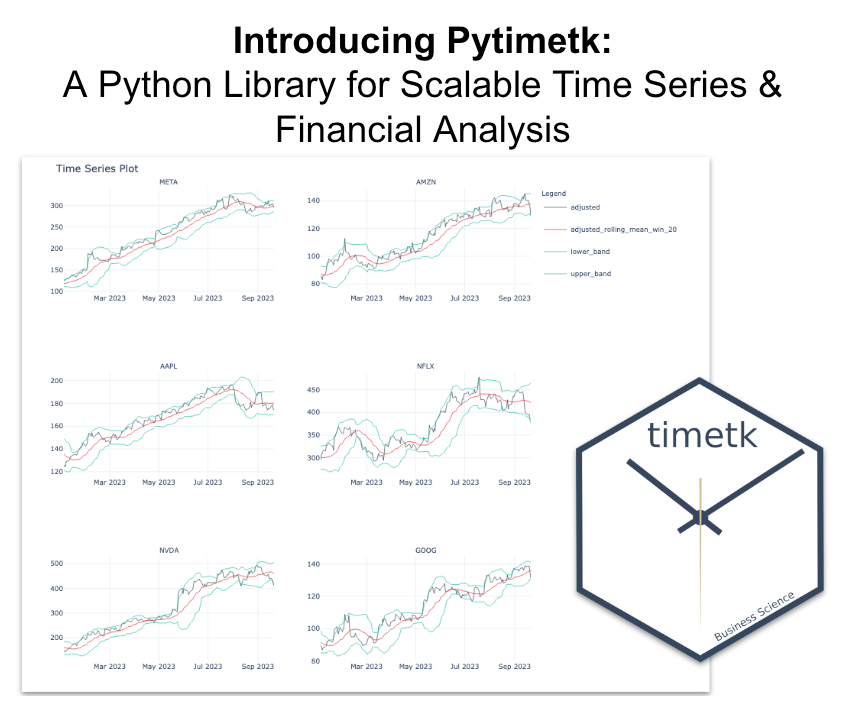
BONUS #1: Adding Customized Bollinger Bands to 6 Stocks
The code for this tutorial also covers how to make interactive Bollinger Band visualizations. Bollinger Bands can help you examine both trend and volatility for various stocks. Join the newsletter to get the code. It's in the QS005 folder.

Get the code: It's in the QS005 folder.
Conclusion: Python is getting even better for Stock Analysis
By now you can tell that we are giving you every POSSIBLE tool and skill to enhance your Algorithmic Trading game.
Don't forget to attend the Live Workshop with us and Snowflake on October 1th. This workshop will help you understand how Pytimetk fits into the Python time series ecosystem and what we have in store to help you improve in Quantiative Analysis, Finance and Algorithmic Trading. Click here to register.
Ready to take your investment game to the next level? Embracing Python for algorithmic trading can be a game-changer for your portfolio. If you're new to Python or want to sharpen your skills for financial analysis, our upcoming Python for Algorithmic Trading Course is the perfect opportunity. See you in our Python Algo-Trading course!
Are you feeling lost when trying to learn Algorithmic Trading?
There's nothing worse than going at this alone--
❌ Learning Python is tough.
❌ Learning Trading is tough.
❌ Learning Math & Stats is tough.
It's no wonder why it's easy to feel lost.
And all of this increases the likelihood you will fail (not to mention lose money in the process). Protect your future.

👉 Join 3600+ future Quant Scientists on our Python for Algorithmic Trading Course Waitlist: https://learn.quantscience.io/python-algorithmic-trading-course-waitlist


Start Your Journey To Becoming A Quant Today!
Join the Quant Scientist Newsletter
Gain access to exclusive tools that Wall Street's Elite don't want you to have. Don't miss the next issue...
Join 11,500+ Quant Scientists learning one article at a time
Join 11,500+ Quant Scientists learning one article at a time