
Join the Quant Scientist Newsletter
Gain access to exclusive tools that Wall Street's Elite don't want you to have. Don't miss the next issue...
Join 11,500+ Quant Scientists learning one article at a time
Join 11,500+ Quant Scientists learning one article at a time
How to use MACD for Algorithmic Trading
In this QS Newsletter (get the code), we are sharing research into the MACD (Moving Average Convergence Divergence). Today, you learn:
What MACD is (and why it's important)
Research insights from Machine Learning and Features
BONUS: Get the Python Code for EVERYTHING you see in this post
Disclaimer:
The information and educational material provided by Quant Science, LLC are for educational purposes only and should not be considered as financial advice or recommendations to purchase, hold, or sell any securities or other financial instruments. Before you proceed, please review our full disclaimer here.

Join the Quant Scientist Newsletter (and Get the Code)
Want exclusive access to our FULL codebase for this Quant Science tutorial plus dozens more? The code is in the QS0013 Folder. Join here:

NEW: Free 5-Day Algorithmic Trading Course.
Are you interested in learning Algorithmic Trading with Python? Do you want to learn how to execute trades automatically, how to find edge, backtest trading strategies, analyze risk, then take your winning trades from Paper Account to Production (Live Trading)?
If the answer is Yes, then we have a NEW Free 5-Day Algorithmic Trading.
Click here to join our free 5-Day Algorithmic Trading Course.
What is MACD (and why is it important)?
MACD (Moving Average Convergence Divergence) is most commonly used in Technical Trading. But, it can be used as part of a factor model. Let's see how by applying MACD to NVDA stock price as an example.

1. What is MACD?
MACD is a trend-following momentum indicator that shows the relationship between two moving averages of a security's price. The MACD is calculated by subtracting the long-term exponential moving average (EMA) from the short-term EMA.
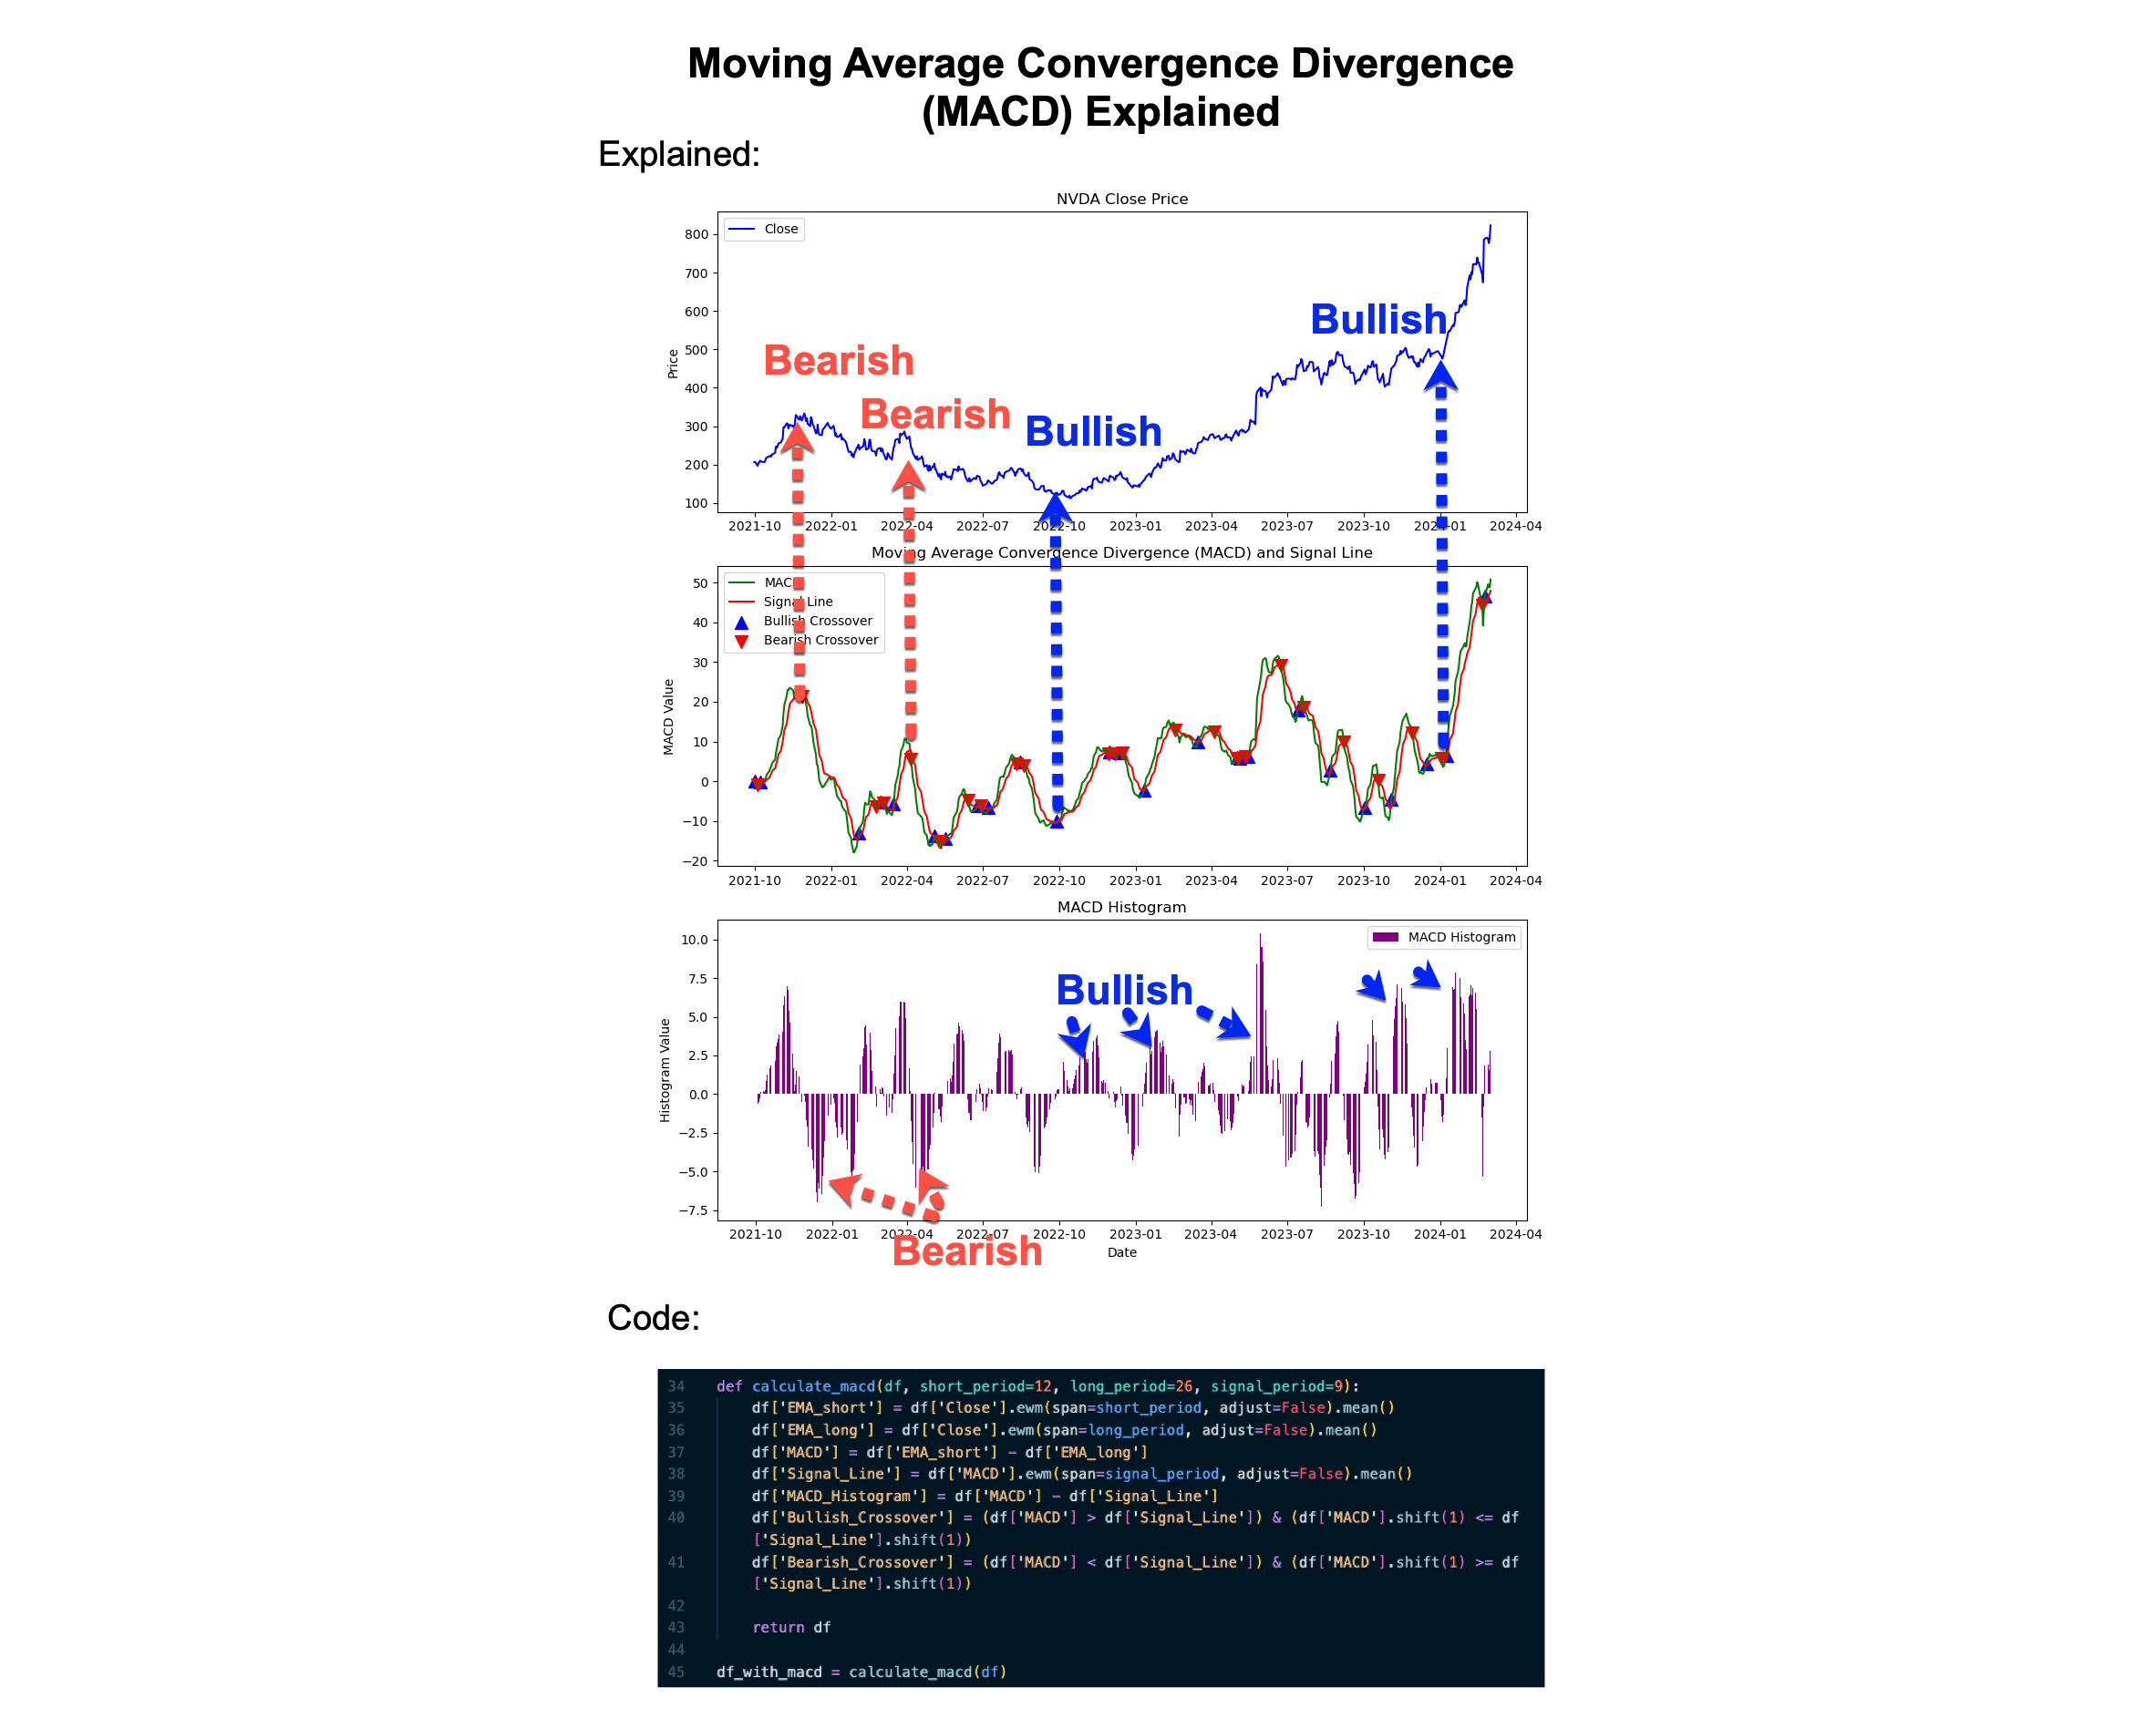
2. Components of MACD (12-26-9 Parameters):
There are 3 main components to how Technical Traders use MACD to generate trading signals. (We'll later examine this from a machine learning feature perspective).
12-26 MACD Line: This is calculated by subtracting the 26-period EMA from the 12-period EMA.
9 Signal Line: This is a 9-period EMA of the MACD Line itself.
12-26-9 MACD Histogram: This is the difference between the 12-26 MACD line and the 9 Signal line.
MACD Histogram with Bullish and Bearish Divergence Shown

3. How MACD is used:
The primary method is to look for crossovers between the MACD line and the signal line. When the MACD line crosses above the signal line, it is a bullish signal. Conversely, when the MACD line crosses below the signal line, it is a bearish signal.
MACD Bullish and Bearish Indicators from Signals

4. Building a Factor Model with 12-26-9 MACD
The question is can MACD be used as a factor (or feature) in an algorithmic trading strategy? These features power our Machine Learning models, and help us to predict: 1D, 5D, 10D, and 21D returns forecasts.
First, we need to create the MACD features in Python:
Get the Python Code (It's in QS013 Folder)

5. Are there any issues with MACD before we assess a relationship?
It's important to assess the indicator before we jump into building a machine learning model. To answer this, I'll share some research from our program.
One of the issues with using MACD overlong time horizons is the issue of Non-Constant Variance. Because of this, it's often better to use a technical indicator like PPO (Percentage Price Oscillator), since PPO is normalized keeping the scale the same throughout time.

6. Is there a tradeable relationship for 12-26-9 MACD?
Next, is there a relationship between MACD Histogram and Forward 1D, 5D, 10D, and 21D returns? To answer this question, I'll share some research from our program.
To analyze for a relationship, we'll investigate the rolling 30-day correlation of the MACD histogram vs 5-day forward returns.

There's on average a -0.237 correlation between the MACD Histogram and the forward 5-day returns over a 30-day rolling period.
Summary of Rolling Correlations MACD vs 5-Day Forward Returns

Conclusion: MACD Algorithmic Trading Observations
Here are the key insights from this analysis:
Can we use 12-26-9 MACD Histogram as a factor (feature)? Yes, the histogram has a negative relationship indicating a machine learning model could gain value from it. I would include it.
What about variance? The standard deviation of rolling correlation is 0.31, which is highly variant. However, this is actually pretty typical in trading due to the noise in the 5-day returns and the noise in trading in general.
Should we use 12-26 PPO instead due to non-constant variance of 12-26-9 MACD Histogram? Use them both and experiment. Our initial results showed a -0.40 correlation between PPO and 5-day forward returns. This means PPO is probably a better method.
What about a 50-200-63 Day MACD? We tried this as well. The magnitude of the mean relationship increased from -0.23 to -0.37 indicating this could be a better feature.
Why is the relationship Negative? One of the most interesting insights is that the MACD Histogram relationship is negative. This could be due to a phenomenon in trading where the most recent month of returns tends to be mean-reverting. This is one of the reasons that momentum indicators typically subtract off the most recent month.
Ready to make Algorithmic Trading Strategies that actually work?
There's nothing worse than going at this alone--
❌ Learning Python is tough.
❌ Learning Trading is tough.
❌ Learning Math & Stats is tough.
It's no wonder why it's easy to feel lost, make bad decisions, and lose money.
Want help?

👉 Join 6,700+ future Quant Scientists on our Python for Algorithmic Trading Course Waitlist: https://learn.quantscience.io/python-algorithmic-trading-course-waitlist


Start Your Journey To Becoming A Quant Today!
Join the Quant Scientist Newsletter
Gain access to exclusive tools that Wall Street's Elite don't want you to have. Don't miss the next issue...
Join 11,500+ Quant Scientists learning one article at a time
Join 11,500+ Quant Scientists learning one article at a time