
Join the Quant Scientist Newsletter
Gain access to exclusive tools that Wall Street's Elite don't want you to have. Don't miss the next issue...
Join 11,500+ Quant Scientists learning one article at a time
Join 11,500+ Quant Scientists learning one article at a time
How to Do Portfolio Analytics in Python (Amazing 1400% Return)
The biggest risk to your trading performance is not knowing your risk. In this QS Newsletter, we're covering how to do portfolio analytics in Python. We'll share a performance and risk analysis of a portfolio that got an "amazing 1400% return". Specifically we will cover:
The 4 Most Important Concepts in Performance and Risk Analysis
Full Python Tutorial ("Amazing 1400% Return"): Risk and Performance Analysis in Python with Quantstats
BONUS: Get the Python Code for EVERYTHING you see in this post
Join the Quant Scientist Newsletter (and Get the Code)
Want exclusive access to our FULL codebase for this Quant Science tutorial plus dozens more? The code is in the QS017 Folder. Join here:

NEW: Free 5-Day Algorithmic Trading Course

Are you interested in learning Algorithmic Trading with Python? Do you want to learn how to execute trades automatically, how to find edge, backtest trading strategies, analyze risk, then take your winning trades from Paper Account to Production (Live Trading)?
If the answer is Yes, then we have a NEW Free 5-Day Algorithmic Trading.
👉 Click here to join our free 5-Day Algorithmic Trading Course.
Top 4 Concepts in Risk and Performance Analysis
"We have an amazing portfolio that got a 1400% return over 10 years."
Have you ever heard an investor say that? How amazing is this portfolio. 1400% sounds great! But what if I told you at one point the investor almost lost everything.
This is why Portfolio Analytics is important for your investing journey.
Portfolio Analytics is the process of assessing the performance, risk, and overall health of an investment portfolio. It involves using various quantitative and qualitative methods to analyze the portfolio's characteristics, performance metrics, and risk factors. There are 4 important parts of risk and peformance analysis that we focus on when analyzing portfolios. They are:
#1. Returns Analysis


Analyzing returns is fundamental to evaluating the performance of a trading strategy over time:
Cumulative Returns: This function calculates the cumulative return of a portfolio over time, providing a visual representation of its growth. It helps in assessing the long-term performance and trend of the strategy.
Monthly Returns: Breaking down returns on a monthly basis allows traders to identify seasonal patterns and monthly performance trends. This can be useful for strategies that may perform differently across different months.
Yearly Returns: Analyzing returns on a yearly basis provides a broader view of performance, helping to identify annual trends and variations in strategy performance.
These analyses enable traders to understand the performance dynamics of their strategies and make data-driven adjustments.
#2. Drawdown Analysis

Drawdown analysis is crucial for understanding the risks associated with a trading strategy. A drawdown is a peak-to-trough decline during a specific period, representing the risk of losing capital. How to analyze drawdowns:
Maximum Drawdown: This metric captures the largest single drop from peak to trough in the portfolio's value. It helps investors understand the worst-case scenario for losses.
Drawdown Duration: This metric measures the time taken to recover from a drawdown. Understanding the duration of drawdowns helps in assessing the resilience and recovery capability of a strategy.
By analyzing drawdowns, traders can gauge the risk profile of their strategies and make informed decisions about risk management.
#3. Performance Metrics

Performance metrics are essential for understanding how well a trading strategy is performing. Here are some of the key metrics:
Risk-Adjusted Returns: Metrics such as the Sharpe ratio, Sortino ratio, and Treynor ratio are used to assess how returns compare to the amount of risk taken.
Sharpe Ratio: This is one of the most widely used metrics, measuring the risk-adjusted return of a portfolio. It is calculated as the ratio of the portfolio's excess return over the risk-free rate to its standard deviation. A higher Sharpe ratio indicates better risk-adjusted performance.
Sortino Ratio: Similar to the Sharpe ratio, the Sortino ratio differentiates between harmful volatility (downside risk) and overall volatility. By focusing on the downside deviation, it provides a more nuanced view of risk-adjusted returns.
Calmar Ratio: This ratio compares the annualized return of an investment to its maximum drawdown. It is particularly useful for evaluating strategies where drawdown control is critical, as it penalizes strategies with large drawdowns.
#4. Risk Metrics

Risk metrics are vital for understanding the exposure and vulnerabilities of a trading strategy:
Volatility: This metric measures the degree of variation in a portfolio's returns over time. Higher volatility implies higher risk, as the portfolio's value can fluctuate significantly.
Value at Risk (VaR): VaR estimates the maximum loss that a portfolio can face over a specified period with a given confidence level. It is a critical measure for risk management and regulatory compliance.
Beta: Beta measures the sensitivity of a portfolio's returns to market movements. A beta greater than 1 indicates higher volatility than the market, while a beta less than 1 indicates lower volatility.
Alpha: Alpha represents the excess return of a portfolio relative to the return predicted by the market. A positive alpha indicates that the portfolio has outperformed the market, while a negative alpha indicates underperformance.
By leveraging these risk metrics, traders can gain a comprehensive understanding of the risks associated with their strategies and implement measures to mitigate them.
Python Tutorial: Risk and Performance Analysis in Python with Quantstats ("AMAZING 1400% Return")
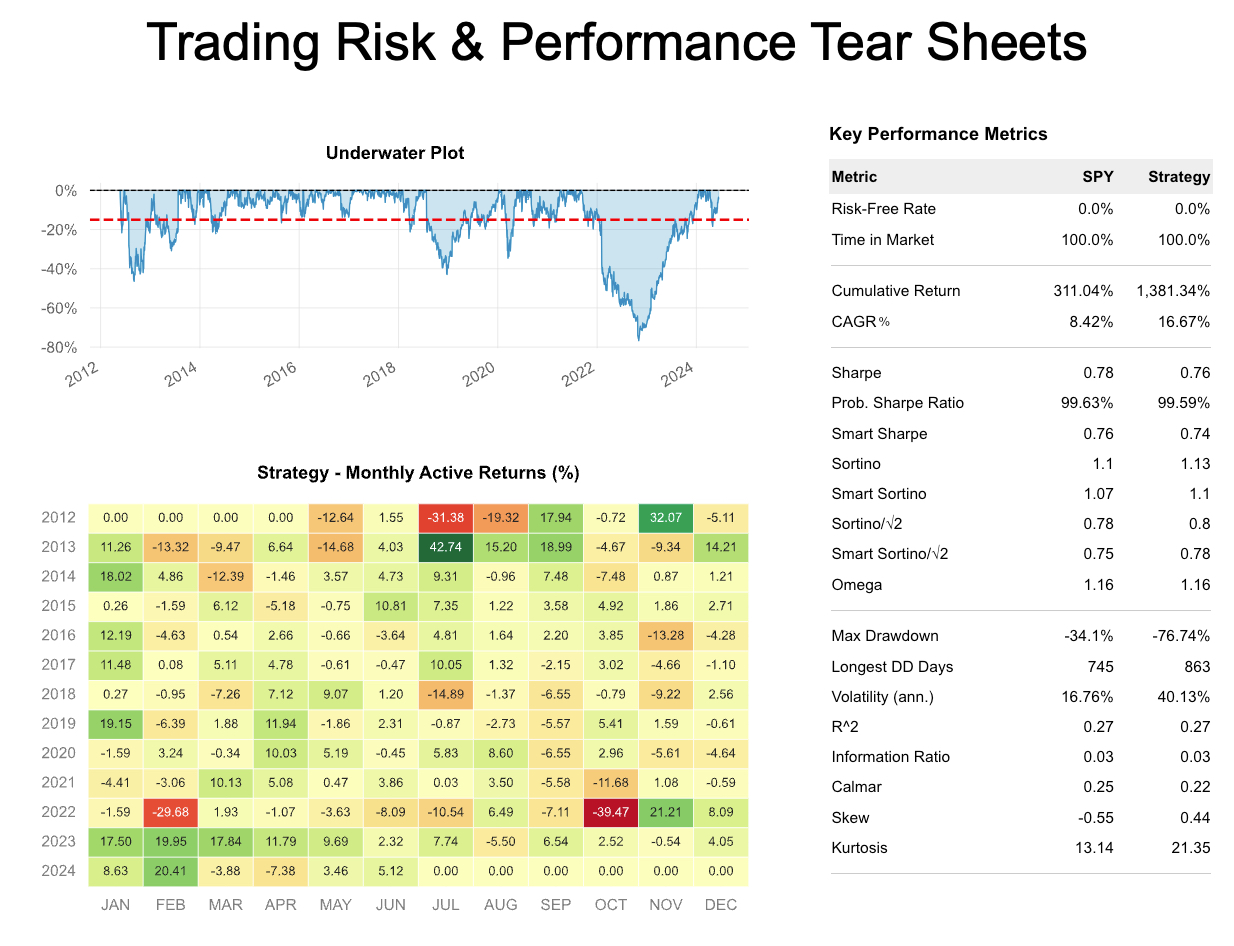
So by now you've seen this Cumulative Returns plot for the portfolio that "made 1400% over 10 years". What is the portfolio?
It's 100% Meta (Facebook).
And here's how quickly you can analyze the quality of the returns of a 100% META portfolio in python with quantstats.

These 4 Lines of Python Code Returns a Full Portfolio Analytics Report
Here's just a sampling of what you get and how you can analyze your portfolio with these 4 lines of code!
Monthly Returns Heatmap
Use this to identify annual cycles, and to spot large drawdowns. We're seeing some wild swings of -39%, -29% and -31%. But we're also seeing some large positive swings of 42%.

Rolling Volatility and Sharpe
Use this to assess the risk level and performance compared to your benchmark. The average 6 moth volatility is more 0.38 vs 0.16 benchmark. This means your taking on 2.4X the risk to gain 2X annualized return.

Drawdowns
Use this to assess your risk of losing big. We can see at one point 100% META portfolio lost -76.7%. That's a lot to stomach.
Conclusion: Don'd just go for returns. Go for responsible investment growth.
Portfolio Analytics is absolutely critical. Returns are only half the battle. It's avoiding taking on too much risk that's the other half. Quantstats is great for analyzing portfolios quickly, but we'd like to help you grow your investments responsibly.
Are you interested in learning active investing strategies that use algorithms to maximize returns responsibly, help you manage risk, and grow your investments? We implement 3 core trading strategies including portfolio, momentum, and spread trades that have worked in our favor in the past and continue to produce results for our students.
Learn with 200+ of us that are learning to apply python to algorithmic trading to grow investments.
Leo was up 11.5% in just 13 trading days.

Alex was waiting 9 years for a course like this:

Ready to make Algorithmic Trading Strategies that actually work?
There's nothing worse than going at this alone--
❌ Learning Python is tough.
❌ Learning Trading is tough.
❌ Learning Math & Stats is tough.
It's no wonder why it's easy to feel lost.
And all of this increases the likelihood you will fail (not to mention lose money in the process). Protect your future.

👉 Join 9,800+ future Quant Scientists on our Python for Algorithmic Trading Course Waitlist: https://learn.quantscience.io/python-algorithmic-trading-course-waitlist


Start Your Journey To Becoming A Quant Today!
Join the Quant Scientist Newsletter
Gain access to exclusive tools that Wall Street's Elite don't want you to have. Don't miss the next issue...
Join 11,500+ Quant Scientists learning one article at a time
Join 11,500+ Quant Scientists learning one article at a time