
Join the Quant Scientist Newsletter
Gain access to exclusive tools that Wall Street's Elite don't want you to have. Don't miss the next issue...
Join 11,500+ Quant Scientists learning one article at a time
Join 11,500+ Quant Scientists learning one article at a time
Relative Strength Index (RSI) for Algorithmic Trading in Python
We are loving the progress we are seeing from our 1st cohort in the Python for Algorithmic Trading course. And we are expanding as we get ready for Cohort 2. Several students have asked for Relative Strength Index (RSI) as a technical indictor. And, we want to fill you in on some powerful algorithmic trading strategies we are exploring. Today we're going to share how to use Relative Strength Index (RSI) to find over-bought and over-sold signals. You learn:
How RSI is used in financial analysis, stocks and investing
Full Python Tutorial: How to use Relative Strength Index (RSI) in Python
BONUS: Get the Python Code for EVERYTHING you see in this post
Disclaimer:
The information and educational material provided by Quant Science, LLC are for educational purposes only and should not be considered as financial advice or recommendations to purchase, hold, or sell any securities or other financial instruments. Before you proceed, please review our full disclaimer here.
Quick favor - We're preparing for the next cohort of our new python for algorithmic trading course. If you can spare 60 seconds, we'd love to hear what would help make you a better trader from our course. Click here to enter your 60-second survey.
Here's the RSI overview:
")
You will analyze RSI as a momentum indicator for SPY today (in Python):
Join the Quant Scientist Newsletter (and Get the Code)
Want exclusive access to our FULL codebase for this Quant Science tutorial plus dozens more? The code is in the QS0010 Folder. Join here:

How is Relative Strength Index (RSI) used in Financial Analysis, Stocks, and Investing?
The Relative Strength Index (RSI) is primarily a momentum oscillator. Its main purpose is to indicate overbought and oversold conditions in the price of an asset. Before we dive in, it's useful to gain a clear picture of the ecosystem of momentum oscillators, what they do and what conditions can be helpful to identify trading signals.
8 Momentum Oscillators used in Algorithmic Trading:
We can see that Relative Strength Index (RSI) is in the category of momentum oscillators. And it's one of the top 8 oscillators used for technical trading analysis.

8 Momentum Oscillators Used in Algorithmic Trading
What are Momentum Oscillators?
Momentum oscillators are technical analysis tools used to determine the strength or weakness of an asset's price movement over time. They are designed to identify the speed (velocity) of price movements, helping traders to understand whether the current trend is likely to continue or reverse.
Most momentum oscillators range between two extremes, and their movement is often bound within a certain range, such as 0 to 100.
A key concept in using momentum oscillators is divergence. This occurs when the price of an asset is moving in the opposite direction of the oscillator. For example, if the price is making new highs but the oscillator is not, it can be a sign of weakening momentum and a potential bearish reversal.
Traders use momentum oscillators for various trading strategies, including swing trading, day trading, and trend following. They are often combined with other forms of technical analysis, like trend lines and chart patterns, for more robust trading decisions.
While momentum oscillators can be powerful tools, they are not infallible and can produce false signals, especially in volatile markets or during strong trending periods. Therefore, they should be used in conjunction with other forms of analysis and risk management strategies.
What is Relative Strength Index (RSI)?
RSI, or the Relative Strength Index, is a momentum oscillator commonly used in technical analysis to measure the speed and change of price movements. It helps traders identify overbought or oversold conditions in a traded asset.
The RSI oscillates between 0 and 100. Generally, an RSI above 70 indicates that an asset might be overbought (i.e., potentially overvalued and due for a price correction), while an RSI below 30 suggests it might be oversold (i.e., potentially undervalued and due for a price rebound). A consistently high RSI (above 70) might indicate a strong uptrend, while a consistently low RSI (below 30) might signal a strong downtrend.
When the RSI diverges from the price, it can signal a potential price reversal. For example, if the price of an asset makes a new high but the RSI does not, it may indicate weakening momentum and a possible bearish reversal.
Traders often look for positions to buy in an oversold condition and sell in an overbought condition. However, it's important to note that just because an asset is in overbought or oversold territory, it doesn't mean a reversal is imminent; strong trends can sustain overbought or oversold conditions for extended periods.
RSI is often used in conjunction with other indicators and tools, such as moving averages or MACD, to confirm signals and improve trading accuracy. Like all indicators, RSI is not foolproof. RSI should be used as part of a broader trading strategy, considering fundamental analysis, market trends, and other technical indicators.
Python Tutorial: Relative Strength Index (RSI)
The goal with our analysis is create a momentum oscillator signal in the SPY. We use Relative Strength Index (RSI) to detect periods of potential overbought and oversold conditions. Get the code: It's in the QS010 folder.
Step 1: Load Libraries and Get the SPY Data
The first step in our analysis is to load the following libraries and setup our analysis parameters. Run this code:

Get the code: It's in the QS010 folder.
The code produces this visualization. We can see with have the SPY from 2021-09-30 to 2023-12-13.

Step 2: Apply RSI
Next, let's create an RSI indicator. Run this code:

Get the code: It's in the QS010 folder.
This returns the SPY data frame with the RSI Column added:

Step 3: The RSI Visualization
We can visualize the original SPY Close and the RSI with matplotlib subplots. Run this code:

Get the code: It's in the QS010 folder.
Step 4: RSI Analysis
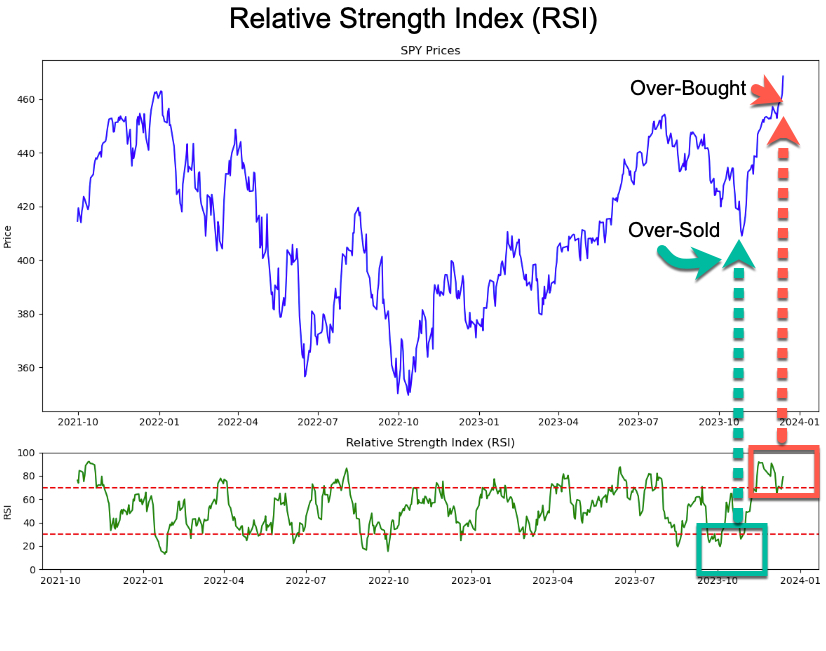
The following plot is returned. Let's analyze it.
I've marked up the original plot so we can see different spots of potentially overbought and oversold conditions. in the long term trading patterns for SPY.
RSI <30: We can see that there was a period of where SPY in November 2023 was oversold. This was followed by a reversal.
RSI >70: In December 2023, RSI has exceeded 70 indicating overbought. RSI alone may not tell us what's going to happen next but could suggest a reversal down.
Get the code: It's in the QS010 folder.
Conclusion: Python is getting even better for Stock Analysis
By now you can tell that we are giving you every POSSIBLE tool and skill to enhance your Algorithmic Trading game.
Ready to take your investment game to the next level? Embracing Python for algorithmic trading can be a game-changer for your portfolio. If you're new to Python or want to sharpen your skills for financial analysis, our upcoming Python for Algorithmic Trading Course is the perfect opportunity. See you in our Python Algo-Trading course!
Are you feeling lost when trying to learn Algorithmic Trading?
There's nothing worse than going at this alone--
❌ Learning Python is tough.
❌ Learning Trading is tough.
❌ Learning Math & Stats is tough.
It's no wonder why it's easy to feel lost.
And all of this increases the likelihood you will fail (not to mention lose money in the process). Protect your future.

👉 Join 5100+ future Quant Scientists on our Python for Algorithmic Trading Course Waitlist: https://learn.quantscience.io/python-algorithmic-trading-course-waitlist


Start Your Journey To Becoming A Quant Today!
Join the Quant Scientist Newsletter
Gain access to exclusive tools that Wall Street's Elite don't want you to have. Don't miss the next issue...
Join 11,500+ Quant Scientists learning one article at a time
Join 11,500+ Quant Scientists learning one article at a time