
Join the Quant Scientist Newsletter
Gain access to exclusive tools that Wall Street's Elite don't want you to have. Don't miss the next issue...
Join 11,500+ Quant Scientists learning one article at a time
Join 11,500+ Quant Scientists learning one article at a time
Signal Processing with Fast Fourier Transform in Python
As we continue to build onto the Python for Algorithmic Trading course, and Jason and I are keenly interested in Signal Processing. And, we want to fill you in on some powerful algorithmic trading strategies we are exploring. Today we're going to share how to use Fast Fourier Transform to find dominant frequencies and de-noise the series using signal processing. You learn:
How is Fast Fourier Transform (FFT) used in financial analysis, stocks and investing?
Full Python Tutorial: Signal Processing with Fast Fourier Transform (FFT) in Python
BONUS: Get the Python Code for EVERYTHING you see in this post
Disclaimer:
The information and educational material provided by Quant Science, LLC are for educational purposes only and should not be considered as financial advice or recommendations to purchase, hold, or sell any securities or other financial instruments. Before you proceed, please review our full disclaimer here.
Quick favor - We're preparing for the next cohort of our new python for algorithmic trading course. If you can spare 60 seconds, we'd love to hear what would help make you a better trader from our course. Click here to enter your 60-second survey.
Join the Quant Scientist Newsletter (and Get the Code)
Want exclusive access to our FULL codebase for this Quant Science tutorial plus dozens more? The code is in the QS008 Folder. Join here:

How is Fast Fourier Transform (FFT) used in Financial Analysis, Stocks, and Investing?
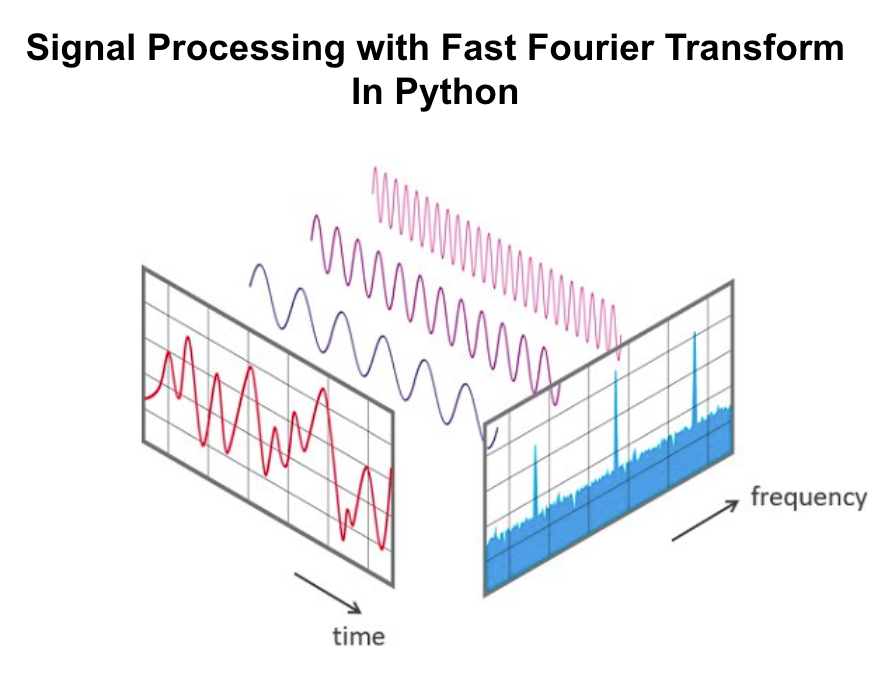
The Fast Fourier Transform (FFT) is a powerful tool in financial analysis, particularly for stocks and investing, due to its ability to analyze time series data, which is a staple in financial markets. The FFT algorithm uses signal processing to detect the most significant frequencies (see figure):

How the Fast Fourier Transform identifies signals
Here are some key applications in Financial Analysis, Stocks, and Investing:
1. Trend Analysis:
Detecting Cycles: FFT can help identify cyclical patterns in stock prices or economic indicators. By decomposing a time series into its frequency components, analysts can detect regular cycles, such as seasonal trends or business cycles.
Trend Filtering: It can be used to filter out short-term fluctuations or noise from long-term trends, helping in smoothing out time series data to better understand underlying trends.
2. Risk Management:
Volatility Analysis: FFT can aid in analyzing the frequency and amplitude of price fluctuations, which is crucial for assessing volatility in financial markets. This information is vital for risk management and for strategies like hedging.
3. Algorithmic Trading:
Signal Processing: In algorithmic trading, FFT is used for signal processing, extracting meaningful patterns or trends from market data that can be used to inform automated trading strategies.
High-Frequency Trading (HFT): FFT is particularly useful in HFT, where it's essential to analyze market data and make decisions in fractions of a second.
4. Option Pricing Models:
Option Valuation: FFT is used in some advanced option pricing models, like the Fast Fourier Transform approach for option pricing, which allows for efficient computation of option prices in models with complex features.
5. Portfolio Optimization:
Asset Correlation Analysis: By analyzing the frequency components of different asset returns, FFT can help in understanding correlations and diversification potential in a portfolio.
6. Economic Forecasting:
Macroeconomic Data Analysis: FFT can be applied to macroeconomic indicators to forecast economic trends, which can have a substantial impact on investment strategies.
7. Spectral Analysis:
Understanding Market Dynamics: Spectral analysis using FFT helps in understanding the dynamics of the financial market by analyzing the distribution of power across various frequency components.
Python Tutorial: How to make an Algorithmic Trading Strategy using Machine Learning
The goal with our analysis is detect signals in the SPY. We'll then invert the FFT to recreate both the original time series and a simplified version of the SPY that shows it's trend. Get the code: It's in the QS008 folder.
Step 1: Load Libraries and Get the SPY Data
The first step in our analysis is to load the following libraries and setup our analysis parameters. Run this code:

Get the code: It's in the QS008 folder.
The code produces this visualization. We can see with have the SPY from 2021-09-30 to 2023-09-30.

Step 2: Apply FFT
Next, let's apply the Fast Fourier Transform. There a few key points:
We use
np.fft.fft()to perform the fit transformations.We get the frequencies using
np.fft.fftfreq()We can plot the magnitude vs periods to indicate when the most important frequencies occur.
Run this code:

Get the code: It's in the QS008 folder.
This returns an the SPY with the FFT frequency plot below it.

Important Point on the Dominant FFT Frequencies:
The frequency plot above shows the frequencies that tend to dominate the time series. We can then use these to invert the FFT recreating the original time series or a version with noise removed.
But the importance of the dominant frequencies goes beyond just recreating the time series. The dominant frequencies could be tied to events (key economic reports, macroeconomic events, etc) that influence the structure of the time series. This is how Signal Processing can help algorithmic traders key in on trading signals. We'll dive into this more in the course.
Getting the Dominant FFT Frequencies:

Step 3: Recover the original time series
We can recover the original time series with the np.fft.ifft() function, which inverts the fft_results. Run this code:

Get the code: It's in the QS008 folder.
The inverted time series is overlayed on top of the original SPY time series. We can see that it's perfectly reconstructed.

Step 4: Reconstruction with Dominant Periods
In practice, your goal isn't to reconstruct the time series. But rather to reconstruct a de-noised version of the time series from the N-largest (most dominant) FFT periods. We can do this with a slight modification to the previous code. Run this code:

Get the code: It's in the QS008 folder.
This produces the reconstructed SPY with only the top 25 FFT frequencies. This is essential a de-noised version of the original series. And now you have the signal through the noise!

Conclusion: Python is getting even better for Stock Analysis
By now you can tell that we are giving you every POSSIBLE tool and skill to enhance your Algorithmic Trading game.
Ready to take your investment game to the next level? Embracing Python for algorithmic trading can be a game-changer for your portfolio. If you're new to Python or want to sharpen your skills for financial analysis, our upcoming Python for Algorithmic Trading Course is the perfect opportunity. See you in our Python Algo-Trading course!
Are you feeling lost when trying to learn Algorithmic Trading?
There's nothing worse than going at this alone--
❌ Learning Python is tough.
❌ Learning Trading is tough.
❌ Learning Math & Stats is tough.
It's no wonder why it's easy to feel lost.
And all of this increases the likelihood you will fail (not to mention lose money in the process). Protect your future.

👉 Join 3600+ future Quant Scientists on our Python for Algorithmic Trading Course Waitlist: https://learn.quantscience.io/python-algorithmic-trading-course-waitlist


Start Your Journey To Becoming A Quant Today!
Join the Quant Scientist Newsletter
Gain access to exclusive tools that Wall Street's Elite don't want you to have. Don't miss the next issue...
Join 11,500+ Quant Scientists learning one article at a time
Join 11,500+ Quant Scientists learning one article at a time