
Join the Quant Scientist Newsletter
Gain access to exclusive tools that Wall Street's Elite don't want you to have. Don't miss the next issue...
Join 11,500+ Quant Scientists learning one article at a time
Join 11,500+ Quant Scientists learning one article at a time
Uncover Investment Opportunities with Python: A Guide to Algorithmic Trading
Today, we are sharing the stock screening code we will use to screen stocks for trades in the Python for Algorithmic Trading course. This article gives a sneak peek into the intricacies of the Python research code. We cover:
Stock Screening: Unearthing Hidden Gems
Investment Data Retrieval: Fueling Informed Decisions
Visualization: The Power of Insightful Graphs
BONUS: How to join our Course Waitlist (and get exclusive insider perks) 👇
Join the Quant Scientist Newsletter (and Get the Code)
Want exclusive access to our FULL codebase for this Quant Science tutorial plus dozens more? The code is in the QS003 Folder. Join here:

Python for Investment Research
In today's fast-paced financial markets, staying ahead of the curve requires innovative tools and strategies. Algorithmic trading, powered by Python programming, has emerged as a valuable approach to identify investment opportunities, analyze data, and make informed trading decisions.
In this article, we'll delve into a practical example that showcases how Python can be harnessed to perform stock screening and retrieve valuable stock data for potential investments. Additionally, we'll demonstrate the power of data visualization in gaining insights from historical stock price data. Are you ready to enhance your trading toolkit? Read on to discover how Python can be a game-changer for your investment journey.

Stock Screening: Unearthing Hidden Gems
The first step towards successful algorithmic trading is identifying promising stocks. Python, along with the openbb_terminal SDK, offers a seamless way to screen stocks based on specific criteria.
Imagine you're looking for stocks that have hit new highs and are trading above $15, primarily in the USA. With a few lines of Python code, you can automate this process, saving time and ensuring you never miss out on potentially lucrative opportunities. Here's how:

The script starts by importing the necessary modules:
openbbfrom theopenbb_terminal.sdkpackage andpandasaspd.The code then runs a stock screener using the
openbbSDK. Specifically, it queries for stocks that are making new highs ("new_high"). The data source is finviz.com.The results of the stock screener are stored in the
new_highsDataFrame.The code filters the
new_highsDataFrame further, keeping only those stocks where the Price is greater than $15.00 and the Country is USA. The filtered data is stored in theportfolio_dataDataFrame.
Here's what the portfolio_data looks like:

Data Retrieval: Fueling Informed Decisions
Once you've narrowed down your stock choices, it's crucial to back your decisions with data. Python allows you to pull historical stock price data efficiently.
In our example, we demonstrate how to fetch stock data for a selected list of tickers within a specified time range. By harnessing Python's data handling capabilities and utilizing the openbb_terminal SDK, you gain access to the insights necessary to make well-informed investment decisions.

The stock data returned for each ticker comes from openbb.economy.index(). Here's the return DataFrame:

Visualization: The Power of Insightful Graphs
Numbers alone can be overwhelming, but Python's data visualization tools transform raw data into actionable insights. Visualizing historical stock price data helps you identify trends, patterns, and potential entry or exit points.
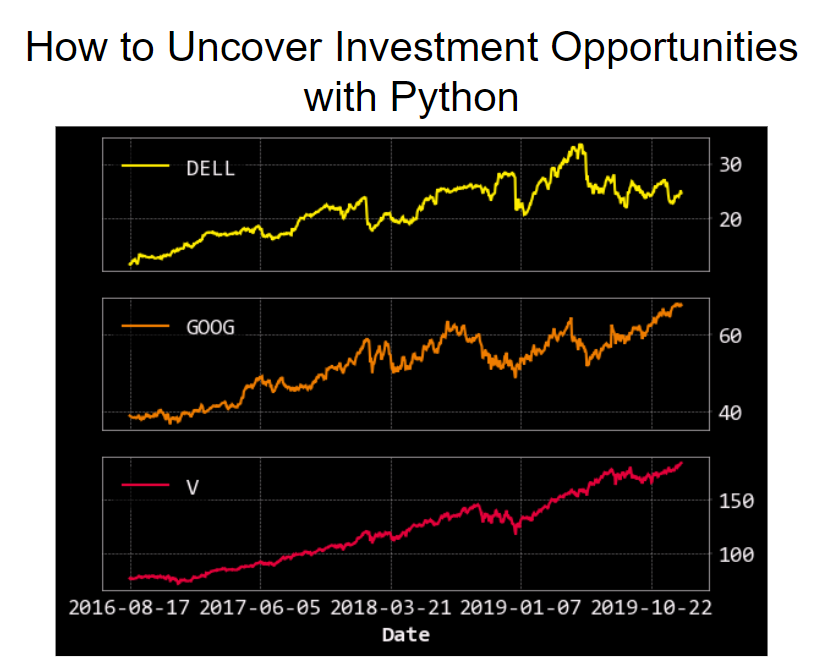
The article showcases how Python's Pandas library and plotting functions can be employed to visualize stock price data, enabling you to understand the historical performance of selected stocks and make informed predictions.

The two plots show examples of visualizing a single asset and multiple assets:
Single Stock:

Multiple Stocks (Subplots = True):

Conclusion: Python is great for stock analysis
We've seen how powerful Python is for financial analysis.
Algorithmic trading powered by Python streamlines stock screening, data retrieval, and analysis.
Python's data visualization tools offer valuable insights from historical stock price data.
Leveraging Python empowers you to make informed investment decisions and stay ahead in the competitive financial markets.
Ready to take your investment game to the next level? Embracing Python for algorithmic trading can be a game-changer for your portfolio. If you're new to Python or want to sharpen your skills for financial analysis, our upcoming Python for Algorithmic Trading Course is the perfect opportunity. See you in our Python Algo-Trading course!
Are you feeling lost when trying to learn Algorithmic Trading?
There's nothing worse than going at this alone--
❌ Learning Python is tough.
❌ Learning Trading is tough.
❌ Learning Math & Stats is tough.
It's no wonder why it's easy to feel lost.
And all of this increases the likelihood you will fail (not to mention lose money in the process). Protect your future.

👉 Join 2200+ future Quant Scientists on our Python for Algorithmic Trading Course Waitlist: https://learn.quantscience.io/python-algorithmic-trading-course-waitlist


Start Your Journey To Becoming A Quant Today!
Join the Quant Scientist Newsletter
Gain access to exclusive tools that Wall Street's Elite don't want you to have. Don't miss the next issue...
Join 11,500+ Quant Scientists learning one article at a time
Join 11,500+ Quant Scientists learning one article at a time